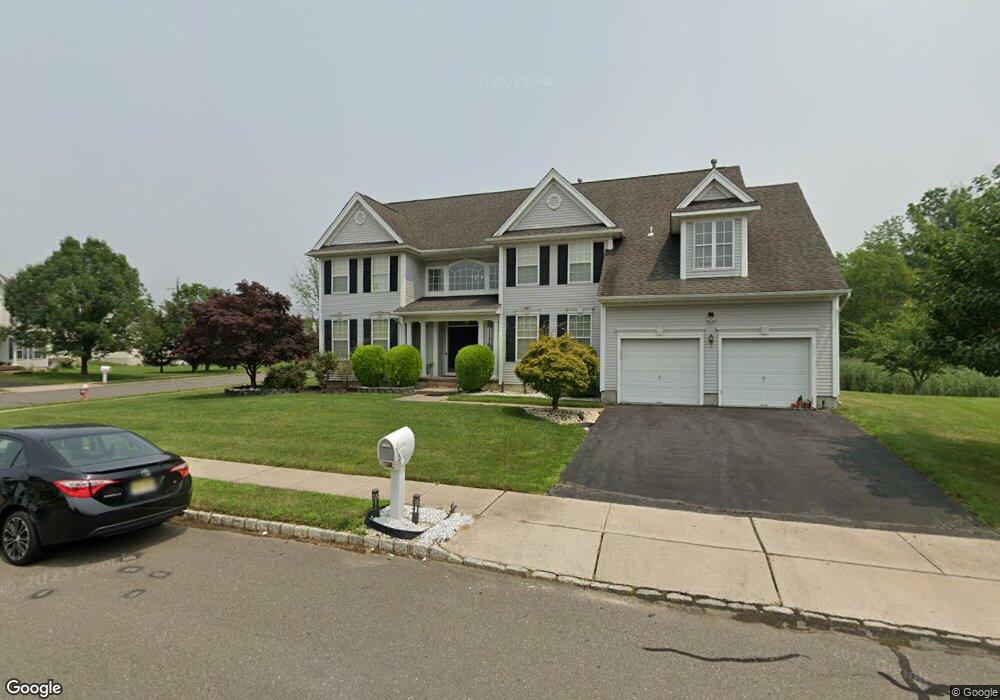
2 Declan Ct Monmouth Junction, NJ 08852
Estimated Value: $952,475 - $1,128,000
--
Bed
--
Bath
3,033
Sq Ft
$351/Sq Ft
Est. Value
About This Home
This home is located at 2 Declan Ct, Monmouth Junction, NJ 08852 and is currently estimated at $1,063,869, approximately $350 per square foot. 2 Declan Ct is a home located in Middlesex County with nearby schools including Monmouth Junction Elementary School, Crossroads North Middle School, and South Brunswick High School.
Ownership History
Date
Name
Owned For
Owner Type
Purchase Details
Closed on
Nov 23, 2010
Sold by
Ramasamy Ramesh
Bought by
Ramasamy Ramesh
Current Estimated Value
Home Financials for this Owner
Home Financials are based on the most recent Mortgage that was taken out on this home.
Original Mortgage
$225,000
Outstanding Balance
$136,567
Interest Rate
2.75%
Mortgage Type
New Conventional
Estimated Equity
$927,302
Purchase Details
Closed on
Oct 25, 2000
Sold by
D R Horton Inc
Bought by
Ramasamy Ramesh
Home Financials for this Owner
Home Financials are based on the most recent Mortgage that was taken out on this home.
Original Mortgage
$250,000
Interest Rate
7.81%
Create a Home Valuation Report for This Property
The Home Valuation Report is an in-depth analysis detailing your home's value as well as a comparison with similar homes in the area
Home Values in the Area
Average Home Value in this Area
Purchase History
| Date | Buyer | Sale Price | Title Company |
|---|---|---|---|
| Ramasamy Ramesh | -- | None Available | |
| Ramasamy Ramesh | $321,990 | -- |
Source: Public Records
Mortgage History
| Date | Status | Borrower | Loan Amount |
|---|---|---|---|
| Open | Ramasamy Ramesh | $225,000 | |
| Closed | Ramasamy Ramesh | $250,000 |
Source: Public Records
Tax History Compared to Growth
Tax History
| Year | Tax Paid | Tax Assessment Tax Assessment Total Assessment is a certain percentage of the fair market value that is determined by local assessors to be the total taxable value of land and additions on the property. | Land | Improvement |
|---|---|---|---|---|
| 2025 | $14,580 | $269,900 | $90,000 | $179,900 |
| 2024 | $14,056 | $269,900 | $90,000 | $179,900 |
| 2023 | $14,056 | $269,900 | $90,000 | $179,900 |
| 2022 | $13,638 | $269,900 | $90,000 | $179,900 |
| 2021 | $8,896 | $269,900 | $90,000 | $179,900 |
| 2020 | $13,722 | $269,900 | $90,000 | $179,900 |
| 2019 | $13,846 | $269,900 | $90,000 | $179,900 |
| 2018 | $13,392 | $269,900 | $90,000 | $179,900 |
| 2017 | $13,374 | $269,900 | $90,000 | $179,900 |
| 2016 | $13,233 | $269,900 | $90,000 | $179,900 |
| 2015 | $12,828 | $269,900 | $90,000 | $179,900 |
| 2014 | $12,621 | $269,900 | $90,000 | $179,900 |
Source: Public Records
Map
Nearby Homes
- 45 Old New Rd
- 3 Gramercy Rd
- 6 Donner Ct
- 4 Donner Ct
- 586 Ridge Rd
- 6 Monet Ct
- 32 Magnolia Ct
- 22 Witch Hazel Ct Unit 2
- 4 Drinking Brook Rd
- 61 Stouts Ln
- 260 Friendship Rd
- 209 Gambocz Ct
- 254 Friendship Rd
- 5192 Beech Ct
- 8 Marc Dr
- 7041 Elm Ct
- 45 Hannah Dr
- 6143 Cedar Ct
- 9 Kearns Place Unit 3805
- 4031 Bayberry Ct