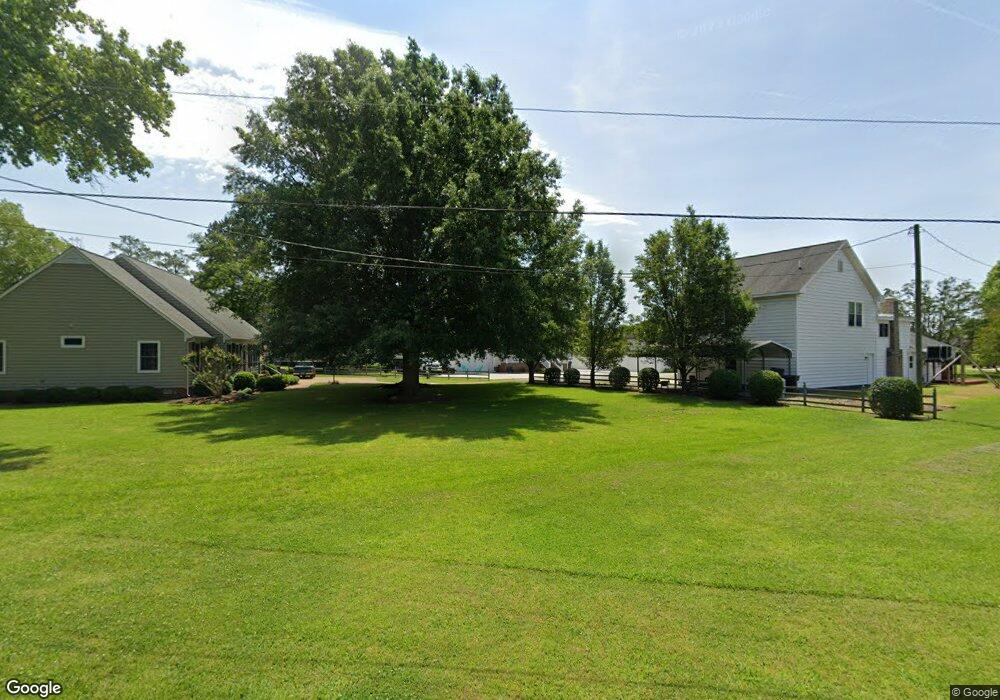
2 Deerview Ln Hampton, VA 23664
Fox Hill NeighborhoodEstimated Value: $474,000 - $503,000
5
Beds
4
Baths
2,960
Sq Ft
$163/Sq Ft
Est. Value
About This Home
This home is located at 2 Deerview Ln, Hampton, VA 23664 and is currently estimated at $483,655, approximately $163 per square foot. 2 Deerview Ln is a home located in Hampton City with nearby schools including Francis Asbury Elementary School, Benjamin Syms Middle School, and Kecoughtan High School.
Ownership History
Date
Name
Owned For
Owner Type
Purchase Details
Closed on
Jul 30, 2021
Sold by
Hooker Jerry D and Hooker Mary M
Bought by
Hooker Chad S and Hooker Hannah B
Current Estimated Value
Purchase Details
Closed on
Oct 29, 2001
Sold by
Bone Donald G
Bought by
Hooker Jerry D
Home Financials for this Owner
Home Financials are based on the most recent Mortgage that was taken out on this home.
Original Mortgage
$180,500
Outstanding Balance
$71,276
Interest Rate
6.86%
Estimated Equity
$412,379
Create a Home Valuation Report for This Property
The Home Valuation Report is an in-depth analysis detailing your home's value as well as a comparison with similar homes in the area
Home Values in the Area
Average Home Value in this Area
Purchase History
| Date | Buyer | Sale Price | Title Company |
|---|---|---|---|
| Hooker Chad S | -- | None Available | |
| Hooker Jerry D | $177,000 | -- |
Source: Public Records
Mortgage History
| Date | Status | Borrower | Loan Amount |
|---|---|---|---|
| Open | Hooker Jerry D | $180,500 |
Source: Public Records
Tax History
| Year | Tax Paid | Tax Assessment Tax Assessment Total Assessment is a certain percentage of the fair market value that is determined by local assessors to be the total taxable value of land and additions on the property. | Land | Improvement |
|---|---|---|---|---|
| 2025 | $5,330 | $463,900 | $66,200 | $397,700 |
| 2024 | $5,076 | $441,400 | $66,200 | $375,200 |
| 2023 | $4,975 | $428,900 | $66,200 | $362,700 |
| 2022 | $4,681 | $396,700 | $66,200 | $330,500 |
| 2021 | $4,480 | $346,300 | $66,200 | $280,100 |
| 2020 | $3,832 | $309,000 | $66,200 | $242,800 |
| 2019 | $3,832 | $309,000 | $66,200 | $242,800 |
| 2018 | $2,010 | $309,000 | $66,200 | $242,800 |
| 2017 | $3,926 | $0 | $0 | $0 |
| 2016 | $3,926 | $309,000 | $0 | $0 |
| 2015 | $3,926 | $0 | $0 | $0 |
| 2014 | $4,006 | $309,000 | $66,200 | $242,800 |
Source: Public Records
Map
Nearby Homes
Your Personal Tour Guide
Ask me questions while you tour the home.