Estimated Value: $498,000 - $599,000
2
Beds
3
Baths
2,078
Sq Ft
$258/Sq Ft
Est. Value
About This Home
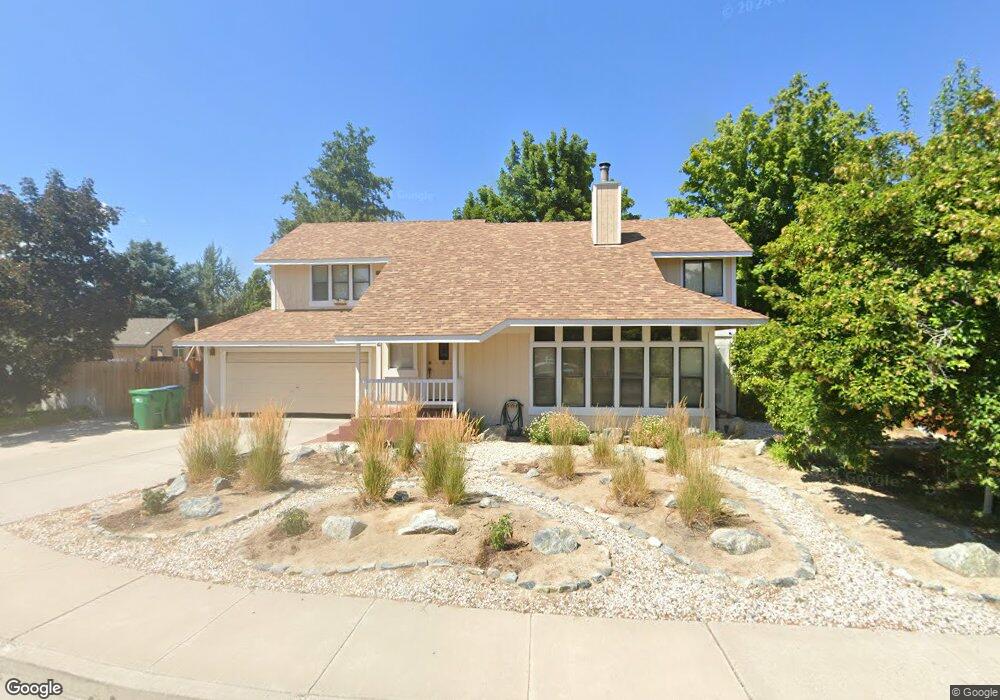
This home is located at 2 Denio Ct, Carson City, NV 89706 and is currently estimated at $536,123, approximately $257 per square foot. 2 Denio Ct is a home located in Carson City with nearby schools including Fritsch Elementary School, Carson Middle School, and Carson High School.
Ownership History
Date
Name
Owned For
Owner Type
Purchase Details
Closed on
Dec 24, 2019
Sold by
Peter Owens Carsten
Bought by
Carsten Peter Owens Revocable
Current Estimated Value
Purchase Details
Closed on
Jan 3, 2018
Sold by
Owens Carsten P
Bought by
Owens Carsten Peter and Carsten Peter Owens Revocable Living Tru
Home Financials for this Owner
Home Financials are based on the most recent Mortgage that was taken out on this home.
Original Mortgage
$190,000
Interest Rate
3.92%
Mortgage Type
New Conventional
Purchase Details
Closed on
Jul 14, 2014
Sold by
Parker Robert G and Parker Barbara Ann
Bought by
Owens Carsten P
Home Financials for this Owner
Home Financials are based on the most recent Mortgage that was taken out on this home.
Original Mortgage
$161,029
Interest Rate
4.25%
Mortgage Type
FHA
Create a Home Valuation Report for This Property
The Home Valuation Report is an in-depth analysis detailing your home's value as well as a comparison with similar homes in the area
Home Values in the Area
Average Home Value in this Area
Purchase History
| Date | Buyer | Sale Price | Title Company |
|---|---|---|---|
| Carsten Peter Owens Revocable | -- | New Title Company Name | |
| Owens Carsten Peter | -- | None Available | |
| Owens Carsten P | $164,000 | Stewart Title |
Source: Public Records
Mortgage History
| Date | Status | Borrower | Loan Amount |
|---|---|---|---|
| Previous Owner | Owens Carsten Peter | $190,000 | |
| Previous Owner | Owens Carsten P | $161,029 |
Source: Public Records
Tax History Compared to Growth
Tax History
| Year | Tax Paid | Tax Assessment Tax Assessment Total Assessment is a certain percentage of the fair market value that is determined by local assessors to be the total taxable value of land and additions on the property. | Land | Improvement |
|---|---|---|---|---|
| 2025 | $1,967 | $74,681 | $23,100 | $51,581 |
| 2024 | $1,910 | $76,062 | $23,100 | $52,962 |
| 2023 | $1,855 | $71,131 | $21,000 | $50,131 |
| 2022 | $1,801 | $63,474 | $17,850 | $45,624 |
| 2021 | $1,749 | $60,662 | $15,575 | $45,087 |
| 2020 | $1,749 | $58,755 | $14,175 | $44,580 |
| 2019 | $1,647 | $58,710 | $14,175 | $44,535 |
| 2018 | $1,599 | $56,654 | $13,475 | $43,179 |
| 2017 | $1,624 | $56,107 | $12,880 | $43,227 |
| 2016 | $1,514 | $46,694 | $11,200 | $35,494 |
| 2015 | $1,510 | $55,675 | $11,200 | $44,475 |
| 2014 | $1,466 | $44,945 | $9,450 | $35,495 |
Source: Public Records
Map
Nearby Homes
- 4183 Mina Way
- 290 Sarah Dr
- 504 Boulder Dr
- 3616 Imperial Way
- 17 Castle Way
- 3408 Northgate Ln
- 150 Manzanita Terrace
- 210 N Sutro Terrace
- 280 N Sutro Terrace
- 3175 Imperial Way
- 3779 Cambria Loop Unit Lot 62
- 3578 Cambria Loop
- 1112 Drysdale Ct
- 3359 Cambria Loop Unit lot 57
- 3275 Cambria Loop
- 493 Hot Springs Rd Unit 24
- 1110 Jefferson Dr
- 2743 Longridge Dr
- 0 Research Way
- 2937 Gentile Ct