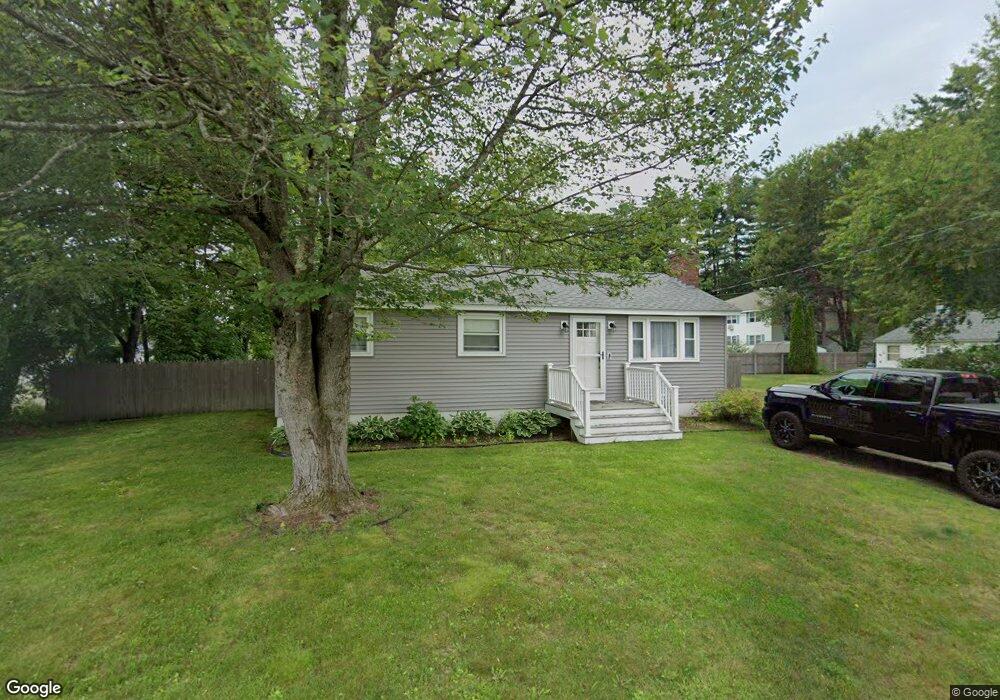
2 Dolly Rd MerriMacK, NH 03054
Estimated Value: $429,000 - $440,688
3
Beds
1
Bath
1,680
Sq Ft
$258/Sq Ft
Est. Value
About This Home
This home is located at 2 Dolly Rd, MerriMacK, NH 03054 and is currently estimated at $433,172, approximately $257 per square foot. 2 Dolly Rd is a home located in Hillsborough County with nearby schools including Reeds Ferry School, James Mastricola Upper Elementary School, and Merrimack Middle School.
Ownership History
Date
Name
Owned For
Owner Type
Purchase Details
Closed on
Aug 17, 2010
Sold by
Us Bank Na Tr
Bought by
Dore Lisa
Current Estimated Value
Home Financials for this Owner
Home Financials are based on the most recent Mortgage that was taken out on this home.
Original Mortgage
$182,541
Outstanding Balance
$121,225
Interest Rate
4.63%
Mortgage Type
Purchase Money Mortgage
Estimated Equity
$311,947
Purchase Details
Closed on
May 25, 2010
Sold by
Caron Matthew
Bought by
Us Bank Na Tr
Purchase Details
Closed on
Feb 25, 2000
Sold by
Desrochers Michael B and Desrochers Tracey D
Bought by
Caron Matthew R and Caron Coreen R
Home Financials for this Owner
Home Financials are based on the most recent Mortgage that was taken out on this home.
Original Mortgage
$120,850
Interest Rate
8.15%
Purchase Details
Closed on
Feb 24, 1997
Sold by
Lewerenz Helen V
Bought by
Desrochers Michael B and Desrochers Tracey D
Create a Home Valuation Report for This Property
The Home Valuation Report is an in-depth analysis detailing your home's value as well as a comparison with similar homes in the area
Home Values in the Area
Average Home Value in this Area
Purchase History
| Date | Buyer | Sale Price | Title Company |
|---|---|---|---|
| Dore Lisa | $185,000 | -- | |
| Us Bank Na Tr | $171,000 | -- | |
| Caron Matthew R | $121,000 | -- | |
| Desrochers Michael B | $92,000 | -- |
Source: Public Records
Mortgage History
| Date | Status | Borrower | Loan Amount |
|---|---|---|---|
| Open | Desrochers Michael B | $182,541 | |
| Previous Owner | Desrochers Michael B | $261,000 | |
| Previous Owner | Desrochers Michael B | $32,461 | |
| Previous Owner | Desrochers Michael B | $120,850 |
Source: Public Records
Tax History Compared to Growth
Tax History
| Year | Tax Paid | Tax Assessment Tax Assessment Total Assessment is a certain percentage of the fair market value that is determined by local assessors to be the total taxable value of land and additions on the property. | Land | Improvement |
|---|---|---|---|---|
| 2024 | $5,497 | $265,700 | $151,100 | $114,600 |
| 2023 | $5,168 | $265,700 | $151,100 | $114,600 |
| 2022 | $4,618 | $265,700 | $151,100 | $114,600 |
| 2021 | $4,562 | $265,700 | $151,100 | $114,600 |
| 2020 | $4,689 | $194,900 | $106,500 | $88,400 |
| 2019 | $4,602 | $190,700 | $106,500 | $84,200 |
| 2018 | $4,600 | $190,700 | $106,500 | $84,200 |
| 2017 | $4,457 | $190,700 | $106,500 | $84,200 |
| 2016 | $4,346 | $190,700 | $106,500 | $84,200 |
| 2015 | $4,457 | $180,300 | $101,500 | $78,800 |
| 2014 | $4,343 | $180,300 | $101,500 | $78,800 |
| 2013 | $4,311 | $180,300 | $101,500 | $78,800 |
Source: Public Records
Map
Nearby Homes
- 10 Kingston Ct Unit 10
- 11 Essex Green Ct
- 22 Essex Green Ct
- 12 Clinton Ct
- 1 Pleasant St
- 19 Vista Way
- 38 Mallard Point
- 22 Clay St
- 29 Bedford Rd
- 1 Tallarico St Unit 14
- 0 Tallarico St Unit 3 5032471
- 0 Tallarico St Unit 5 5032751
- 0 Tallarico St Unit 25 5043170
- 0 Tallarico St Unit 10 5044310
- 0 Tallarico St Unit 12 5033131
- 0 Tallarico St Unit Lot 11 5056385
- 490 Charles Bancroft Hwy
- 7 Hadley Rd
- 8 Highland Green Ln
- 98 Indian Rock Rd