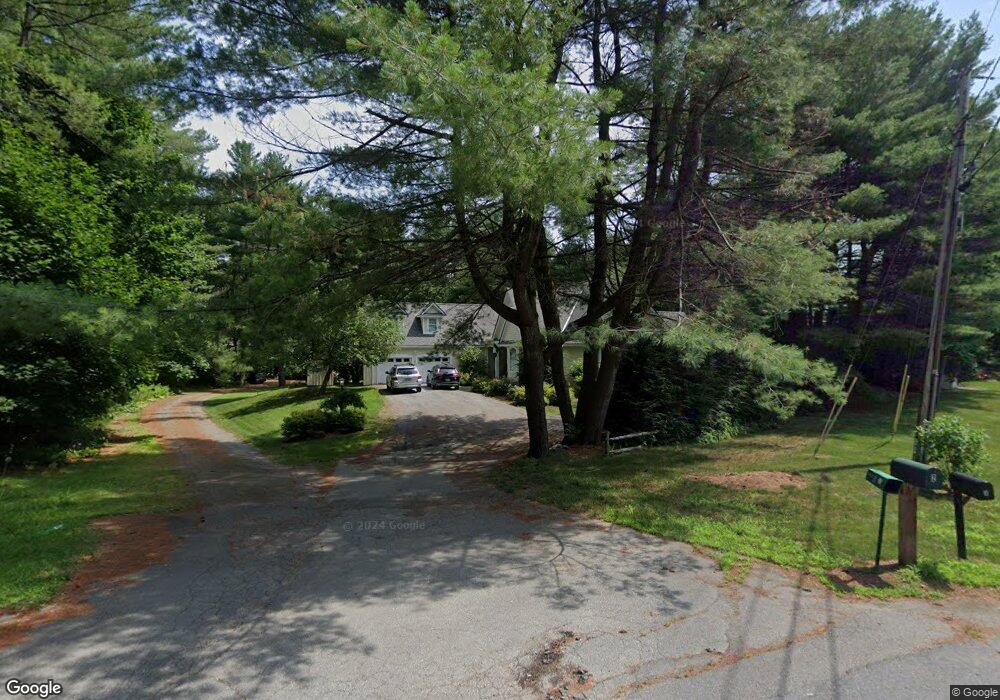
2 Dunster Terrace Hanover, NH 03755
Estimated Value: $1,549,000 - $1,858,000
4
Beds
3
Baths
3,092
Sq Ft
$561/Sq Ft
Est. Value
About This Home
This home is located at 2 Dunster Terrace, Hanover, NH 03755 and is currently estimated at $1,733,453, approximately $560 per square foot. 2 Dunster Terrace is a home located in Grafton County with nearby schools including Bernice A. Ray School, Frances C. Richmond School, and Hanover High School.
Ownership History
Date
Name
Owned For
Owner Type
Purchase Details
Closed on
Jun 7, 2022
Sold by
Stahler John C and Stahler Lynne S
Bought by
Kathleen S Briscoe T S and Kathleen Briscoe
Current Estimated Value
Home Financials for this Owner
Home Financials are based on the most recent Mortgage that was taken out on this home.
Original Mortgage
$1,256,000
Outstanding Balance
$1,189,912
Interest Rate
5.11%
Mortgage Type
Purchase Money Mortgage
Estimated Equity
$543,541
Purchase Details
Closed on
Mar 19, 2013
Sold by
Renzo Anthony F and Renzo Tamara A
Bought by
Stahler John C and Stahler Lynne S
Purchase Details
Closed on
Sep 13, 2002
Sold by
Rip Ridge T
Bought by
Renzo Anthony F and Renzo Tamara A
Create a Home Valuation Report for This Property
The Home Valuation Report is an in-depth analysis detailing your home's value as well as a comparison with similar homes in the area
Home Values in the Area
Average Home Value in this Area
Purchase History
| Date | Buyer | Sale Price | Title Company |
|---|---|---|---|
| Kathleen S Briscoe T S | $1,570,000 | None Available | |
| Kathleen S Briscoe T S | $1,570,000 | None Available | |
| Stahler John C | $700,000 | -- | |
| Stahler John C | $700,000 | -- | |
| Renzo Anthony F | $150,000 | -- | |
| Renzo Anthony F | $150,000 | -- |
Source: Public Records
Mortgage History
| Date | Status | Borrower | Loan Amount |
|---|---|---|---|
| Open | Kathleen S Briscoe T S | $1,256,000 | |
| Closed | Kathleen S Briscoe T S | $1,256,000 | |
| Previous Owner | Renzo Anthony F | $500,000 | |
| Previous Owner | Renzo Anthony F | $145,000 | |
| Closed | Renzo Anthony F | $0 |
Source: Public Records
Tax History Compared to Growth
Tax History
| Year | Tax Paid | Tax Assessment Tax Assessment Total Assessment is a certain percentage of the fair market value that is determined by local assessors to be the total taxable value of land and additions on the property. | Land | Improvement |
|---|---|---|---|---|
| 2024 | $16,852 | $874,500 | $255,200 | $619,300 |
| 2023 | $16,213 | $874,500 | $255,200 | $619,300 |
| 2022 | $15,557 | $874,500 | $255,200 | $619,300 |
| 2021 | $15,426 | $874,500 | $255,200 | $619,300 |
| 2020 | $16,022 | $792,800 | $240,400 | $552,400 |
| 2019 | $15,801 | $792,800 | $240,400 | $552,400 |
| 2018 | $14,388 | $792,800 | $240,400 | $552,400 |
| 2017 | $14,121 | $657,300 | $174,300 | $483,000 |
| 2016 | $13,994 | $657,300 | $174,300 | $483,000 |
| 2015 | $13,724 | $657,300 | $174,300 | $483,000 |
| 2014 | $13,166 | $657,300 | $174,300 | $483,000 |
| 2013 | $12,692 | $657,300 | $174,300 | $483,000 |
| 2012 | $10,358 | $560,200 | $182,800 | $377,400 |
Source: Public Records
Map
Nearby Homes
- 85 Lebanon St
- 2 Brockway Rd
- 5 E Wilder Rd
- 9 Walnut St
- 5 College Hill
- 37 Low Rd
- 13 Hawthorn St
- 33 E Wheelock St
- 1668 Hartford Ave
- 68 Passumpsic Ave
- 2577 Hartford Ave
- 78 Division St
- 99 Depot St
- 61 Depot St
- 131 Brook Hollow
- 126 Brook Hollow
- 1 Depot St
- 55 Horseshoe Ave
- 36 Juniper Dr Unit 6B
- 46A Barrister Dr Unit 205