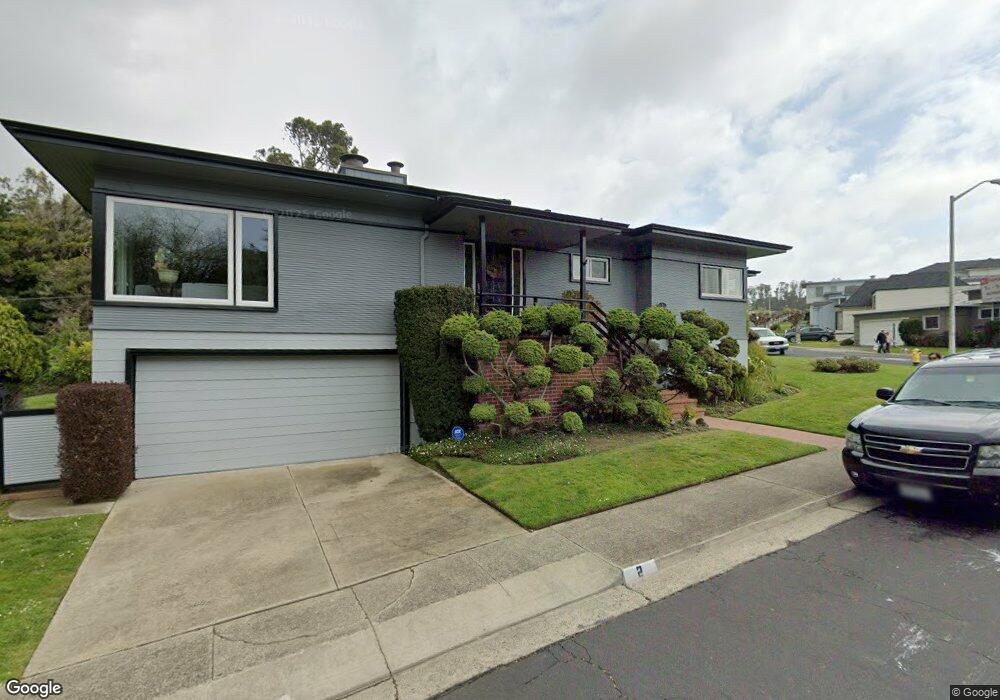
2 El Portal Way Daly City, CA 94015
Westlake NeighborhoodEstimated Value: $1,236,000 - $1,454,040
3
Beds
2
Baths
1,690
Sq Ft
$789/Sq Ft
Est. Value
About This Home
This home is located at 2 El Portal Way, Daly City, CA 94015 and is currently estimated at $1,333,760, approximately $789 per square foot. 2 El Portal Way is a home located in San Mateo County with nearby schools including Westlake Elementary School, Benjamin Franklin Intermediate School, and Jefferson High School.
Ownership History
Date
Name
Owned For
Owner Type
Purchase Details
Closed on
Jan 25, 2021
Sold by
Rainey James M and Rainey Louise M
Bought by
Rainey James M and Rainey Louise M
Current Estimated Value
Home Financials for this Owner
Home Financials are based on the most recent Mortgage that was taken out on this home.
Original Mortgage
$419,450
Interest Rate
3.1%
Mortgage Type
New Conventional
Purchase Details
Closed on
Jan 8, 2013
Sold by
Rainey James M and Rainey Louise M
Bought by
Rainey James M and Rainey Louise M
Home Financials for this Owner
Home Financials are based on the most recent Mortgage that was taken out on this home.
Original Mortgage
$480,500
Interest Rate
3.27%
Mortgage Type
New Conventional
Purchase Details
Closed on
Aug 21, 2008
Sold by
Rainey James Michael and Rainey Louise Marie
Bought by
Rainey James M and Rainey Louise M
Create a Home Valuation Report for This Property
The Home Valuation Report is an in-depth analysis detailing your home's value as well as a comparison with similar homes in the area
Home Values in the Area
Average Home Value in this Area
Purchase History
| Date | Buyer | Sale Price | Title Company |
|---|---|---|---|
| Rainey James M | -- | None Available | |
| Rainey James M | -- | None Available | |
| Rainey James M | -- | Old Republic Title Company | |
| Rainey James M | -- | Old Republic Title Company | |
| Rainey James M | -- | None Available |
Source: Public Records
Mortgage History
| Date | Status | Borrower | Loan Amount |
|---|---|---|---|
| Closed | Rainey James M | $419,450 | |
| Closed | Rainey James M | $480,500 |
Source: Public Records
Tax History Compared to Growth
Tax History
| Year | Tax Paid | Tax Assessment Tax Assessment Total Assessment is a certain percentage of the fair market value that is determined by local assessors to be the total taxable value of land and additions on the property. | Land | Improvement |
|---|---|---|---|---|
| 2025 | $3,627 | $275,357 | $46,182 | $229,175 |
| 2023 | $3,627 | $264,667 | $44,390 | $220,277 |
| 2022 | $3,672 | $259,479 | $43,520 | $215,959 |
| 2021 | $3,332 | $254,393 | $42,667 | $211,726 |
| 2020 | $3,658 | $251,786 | $42,230 | $209,556 |
| 2019 | $3,486 | $246,850 | $41,402 | $205,448 |
| 2018 | $4,018 | $242,012 | $40,591 | $201,421 |
| 2017 | $3,452 | $237,269 | $39,796 | $197,473 |
| 2016 | $3,034 | $232,618 | $39,016 | $193,602 |
| 2015 | $3,699 | $229,125 | $38,430 | $190,695 |
| 2014 | $3,637 | $224,638 | $37,678 | $186,960 |
Source: Public Records
Map
Nearby Homes
- 145 Westdale Ave
- 83 Parkside Ave
- 61 Belmont Dr
- 169 Lake Vista Ave
- 68 Parkwood Dr
- 58 N Mayfair Ave
- 312 Northgate Ave
- 73 Summit Way
- 118 Summit Way
- 88 Fairlawn Ct
- 15 Belle Ave
- 844 Wildwood Ave
- 876 N Mayfair Ave
- 140 Saint Charles Ave
- 19 Willits St
- 768 Stewart Ave
- 8400 Oceanview Terrace Unit 305
- 8400 Oceanview Terrace Unit 309
- 134 Monticello St
- 95 Santa Cruz Ave
- 296 Wilshire Ave
- 1 El Portal Way
- 290 Wilshire Ave
- 87 Cliffside Dr
- 293 Wilshire Ave
- 286 Wilshire Ave
- 79 El Portal Way
- 85 Cliffside Dr
- 86 Cliffside Dr
- 279 Wilshire Ave
- 282 Wilshire Ave
- 186 Westdale Ave
- 83 El Portal Way
- 83 Cliffside Dr
- 4 Manor Ct
- 277 Wilshire Ave
- 80 El Portal Way
- 182 Westdale Ave
- 278 Wilshire Ave
- 14 Manor Ct