Estimated Value: $281,000 - $359,000
4
Beds
2
Baths
1,451
Sq Ft
$212/Sq Ft
Est. Value
About This Home
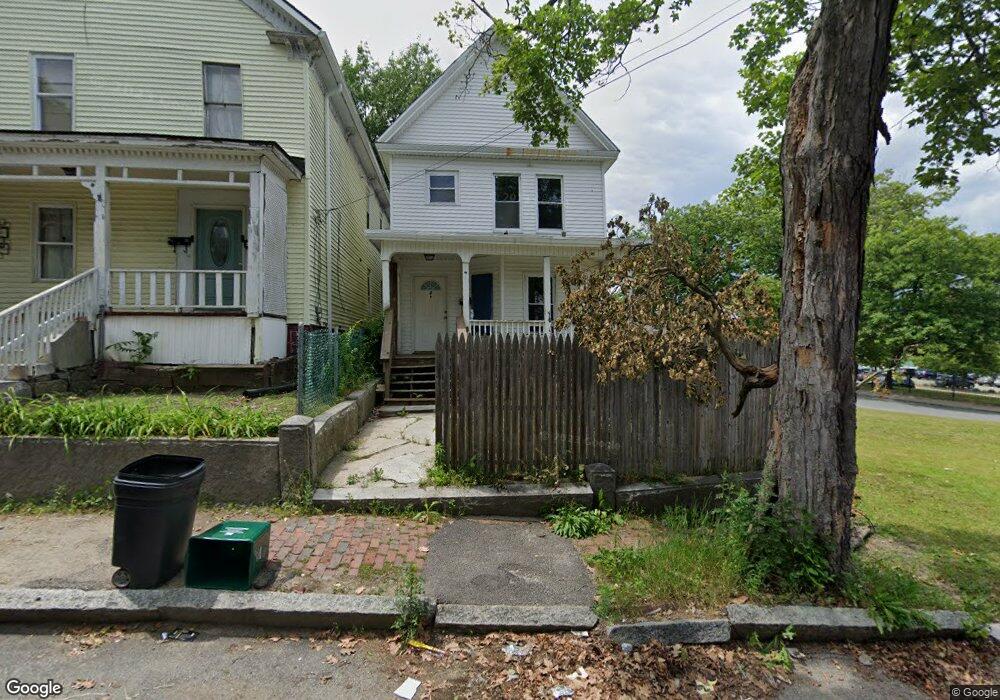
This home is located at 2 Ely St, Worcester, MA 01610 and is currently estimated at $306,936, approximately $211 per square foot. 2 Ely St is a home located in Worcester County with nearby schools including Jacob Hiatt Magnet School, Chandler Magnet, and Woodland Academy.
Ownership History
Date
Name
Owned For
Owner Type
Purchase Details
Closed on
Oct 29, 2008
Sold by
Hatidani Gladys
Bought by
Us Bk
Current Estimated Value
Purchase Details
Closed on
Nov 3, 2004
Sold by
Alchaar Jessimar and Hatidani Paul T
Bought by
Hatidani Gladys
Home Financials for this Owner
Home Financials are based on the most recent Mortgage that was taken out on this home.
Original Mortgage
$168,000
Interest Rate
5.71%
Mortgage Type
Purchase Money Mortgage
Purchase Details
Closed on
Feb 14, 2002
Sold by
Hatidani Paul
Bought by
Alchaar Jessimar
Home Financials for this Owner
Home Financials are based on the most recent Mortgage that was taken out on this home.
Original Mortgage
$139,000
Interest Rate
7.14%
Mortgage Type
Purchase Money Mortgage
Purchase Details
Closed on
Jul 20, 2001
Sold by
Rowan Rt and Miller Sheila R
Bought by
Hatidani Paul
Home Financials for this Owner
Home Financials are based on the most recent Mortgage that was taken out on this home.
Original Mortgage
$72,168
Interest Rate
7.2%
Mortgage Type
Purchase Money Mortgage
Purchase Details
Closed on
Dec 11, 2000
Sold by
Williams Brenda S
Bought by
Rowan Rt and Miller Sheila R
Create a Home Valuation Report for This Property
The Home Valuation Report is an in-depth analysis detailing your home's value as well as a comparison with similar homes in the area
Home Values in the Area
Average Home Value in this Area
Purchase History
| Date | Buyer | Sale Price | Title Company |
|---|---|---|---|
| Us Bk | $92,940 | -- | |
| Hatidani Gladys | $210,000 | -- | |
| Alchaar Jessimar | $147,000 | -- | |
| Hatidani Paul | $74,400 | -- | |
| Rowan Rt | $41,500 | -- |
Source: Public Records
Mortgage History
| Date | Status | Borrower | Loan Amount |
|---|---|---|---|
| Open | Rowan Rt | $55,000 | |
| Previous Owner | Hatidani Gladys | $168,000 | |
| Previous Owner | Rowan Rt | $139,000 | |
| Previous Owner | Rowan Rt | $72,168 | |
| Previous Owner | Rowan Rt | $44,100 |
Source: Public Records
Tax History
| Year | Tax Paid | Tax Assessment Tax Assessment Total Assessment is a certain percentage of the fair market value that is determined by local assessors to be the total taxable value of land and additions on the property. | Land | Improvement |
|---|---|---|---|---|
| 2025 | $2,861 | $216,900 | $33,400 | $183,500 |
| 2024 | $2,771 | $201,500 | $33,400 | $168,100 |
| 2023 | $2,656 | $185,200 | $26,800 | $158,400 |
| 2022 | $2,487 | $163,500 | $21,400 | $142,100 |
| 2021 | $2,421 | $148,700 | $17,100 | $131,600 |
| 2020 | $2,321 | $136,500 | $17,200 | $119,300 |
| 2019 | $2,263 | $125,700 | $16,900 | $108,800 |
| 2018 | $2,226 | $117,700 | $16,900 | $100,800 |
| 2017 | $2,122 | $110,400 | $16,900 | $93,500 |
| 2016 | $2,230 | $108,200 | $15,000 | $93,200 |
| 2015 | $2,172 | $108,200 | $15,000 | $93,200 |
| 2014 | $2,114 | $108,200 | $15,000 | $93,200 |
Source: Public Records
Map
Nearby Homes
Your Personal Tour Guide
Ask me questions while you tour the home.