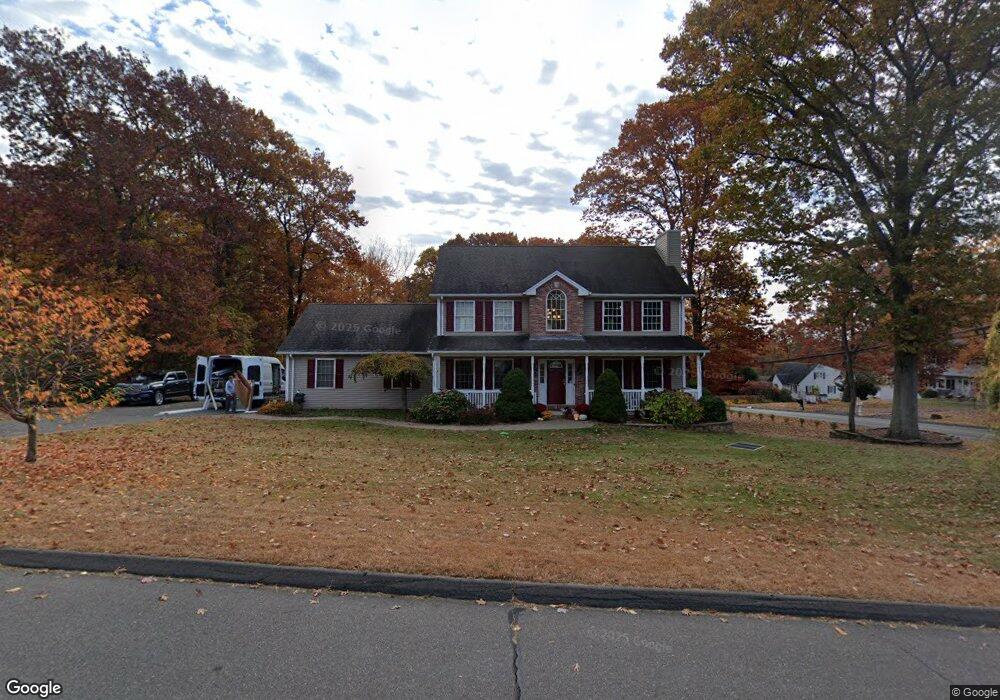
2 Evas Terrace Wolcott, CT 06716
Estimated Value: $519,656 - $661,000
3
Beds
2
Baths
2,250
Sq Ft
$252/Sq Ft
Est. Value
About This Home
This home is located at 2 Evas Terrace, Wolcott, CT 06716 and is currently estimated at $567,164, approximately $252 per square foot. 2 Evas Terrace is a home located in New Haven County with nearby schools including Tyrrell Middle School and Wolcott High School.
Ownership History
Date
Name
Owned For
Owner Type
Purchase Details
Closed on
Jun 16, 2020
Sold by
Embardo Francis and Embardo Regina
Bought by
Jones Amanda and Jones Brian
Current Estimated Value
Home Financials for this Owner
Home Financials are based on the most recent Mortgage that was taken out on this home.
Original Mortgage
$300,050
Outstanding Balance
$264,793
Interest Rate
3.2%
Mortgage Type
Purchase Money Mortgage
Estimated Equity
$302,371
Purchase Details
Closed on
Aug 6, 2015
Sold by
Kalaitzidis Kathy
Bought by
Embardo Francis D and Embardo Regina
Home Financials for this Owner
Home Financials are based on the most recent Mortgage that was taken out on this home.
Original Mortgage
$278,000
Interest Rate
4.03%
Purchase Details
Closed on
Feb 13, 2006
Sold by
Beachwood Ests Llc
Bought by
Kalaitzidis Kathy
Home Financials for this Owner
Home Financials are based on the most recent Mortgage that was taken out on this home.
Original Mortgage
$308,000
Interest Rate
6.27%
Create a Home Valuation Report for This Property
The Home Valuation Report is an in-depth analysis detailing your home's value as well as a comparison with similar homes in the area
Home Values in the Area
Average Home Value in this Area
Purchase History
| Date | Buyer | Sale Price | Title Company |
|---|---|---|---|
| Jones Amanda | $353,000 | None Available | |
| Embardo Francis D | $347,500 | -- | |
| Kalaitzidis Kathy | $385,000 | -- |
Source: Public Records
Mortgage History
| Date | Status | Borrower | Loan Amount |
|---|---|---|---|
| Open | Jones Amanda | $300,050 | |
| Previous Owner | Embardo Francis D | $278,000 | |
| Previous Owner | Kalaitzidis Kathy | $25,000 | |
| Previous Owner | Kalaitzidis Kathy | $308,000 | |
| Previous Owner | Kalaitzidis Kathy | $38,500 |
Source: Public Records
Tax History
| Year | Tax Paid | Tax Assessment Tax Assessment Total Assessment is a certain percentage of the fair market value that is determined by local assessors to be the total taxable value of land and additions on the property. | Land | Improvement |
|---|---|---|---|---|
| 2025 | $8,749 | $243,490 | $51,980 | $191,510 |
| 2024 | $8,052 | $243,490 | $51,980 | $191,510 |
| 2023 | $7,760 | $243,490 | $51,980 | $191,510 |
| 2022 | $7,499 | $243,490 | $51,980 | $191,510 |
| 2021 | $7,366 | $222,270 | $50,780 | $171,490 |
| 2020 | $7,366 | $222,270 | $50,780 | $171,490 |
| 2019 | $7,366 | $222,270 | $50,780 | $171,490 |
| 2018 | $7,157 | $222,270 | $50,780 | $171,490 |
| 2017 | $6,950 | $222,270 | $50,780 | $171,490 |
| 2016 | $6,816 | $235,750 | $49,190 | $186,560 |
| 2015 | $6,620 | $235,750 | $49,190 | $186,560 |
| 2014 | $6,405 | $235,750 | $49,190 | $186,560 |
Source: Public Records
Map
Nearby Homes
- 17 Forestview Dr
- 866 Wolcott Rd
- 63 Lyman Rd
- 1 Winfield Ave
- 128 Lyman Rd Unit 24
- 16 Oakengate Rd
- 8 Oakengate Rd
- 22 Pembroke Hill Rd
- 9 Pembroke Hill Rd
- Lots 70B and 71B Spindle Hill Rd
- 13 Williams Ct
- 43 Williams Ct
- 65 Munson Rd
- 69 Munson Rd
- 24 Janet Ave
- 0 Spindle Hill Rd Unit 24062265
- 24 Granada Dr
- 19 Wagon Trail
- 19 Running Brook Dr
- 226 Clinton Hill Rd
Your Personal Tour Guide
Ask me questions while you tour the home.