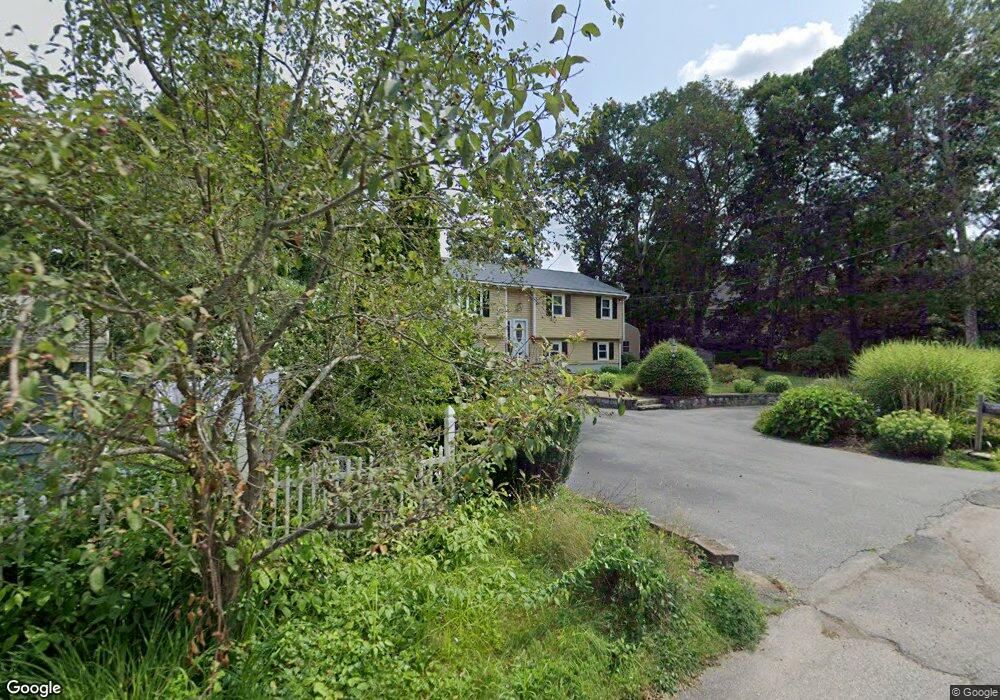
2 Fenway St Wilmington, MA 01887
Estimated Value: $668,000 - $826,000
3
Beds
1
Bath
999,999
Sq Ft
$1/Sq Ft
Est. Value
About This Home
This home is located at 2 Fenway St, Wilmington, MA 01887 and is currently estimated at $749,857, approximately $0 per square foot. 2 Fenway St is a home located in Middlesex County with nearby schools including Wilmington Middle School, Wilmington High School, and Abundant Life Christian School and Childcare.
Ownership History
Date
Name
Owned For
Owner Type
Purchase Details
Closed on
Oct 8, 2021
Sold by
Martin Charles and Martin Paulette
Bought by
Martin Ft 2021
Current Estimated Value
Purchase Details
Closed on
Sep 26, 2003
Sold by
Fitzgerald Deborah A and Fitzgerald Scott A
Bought by
Martin Charles
Purchase Details
Closed on
May 30, 1997
Sold by
Mallett Robert T and Mallett Cheryl M
Bought by
Fitzgerald Scott A
Home Financials for this Owner
Home Financials are based on the most recent Mortgage that was taken out on this home.
Original Mortgage
$167,500
Interest Rate
8.09%
Mortgage Type
Purchase Money Mortgage
Purchase Details
Closed on
Jan 28, 1991
Sold by
Sheridan Dev Co Ltd
Bought by
Mallett Robert T
Create a Home Valuation Report for This Property
The Home Valuation Report is an in-depth analysis detailing your home's value as well as a comparison with similar homes in the area
Home Values in the Area
Average Home Value in this Area
Purchase History
| Date | Buyer | Sale Price | Title Company |
|---|---|---|---|
| Martin Ft 2021 | -- | None Available | |
| Martin Charles | $409,900 | -- | |
| Fitzgerald Scott A | $187,500 | -- | |
| Mallett Robert T | $159,900 | -- |
Source: Public Records
Mortgage History
| Date | Status | Borrower | Loan Amount |
|---|---|---|---|
| Previous Owner | Mallett Robert T | $199,000 | |
| Previous Owner | Mallett Robert T | $165,600 | |
| Previous Owner | Mallett Robert T | $167,500 | |
| Previous Owner | Mallett Robert T | $40,000 |
Source: Public Records
Tax History Compared to Growth
Tax History
| Year | Tax Paid | Tax Assessment Tax Assessment Total Assessment is a certain percentage of the fair market value that is determined by local assessors to be the total taxable value of land and additions on the property. | Land | Improvement |
|---|---|---|---|---|
| 2025 | $7,062 | $616,800 | $272,500 | $344,300 |
| 2024 | $6,996 | $612,100 | $272,500 | $339,600 |
| 2023 | $6,769 | $566,900 | $247,700 | $319,200 |
| 2022 | $6,462 | $495,900 | $206,400 | $289,500 |
| 2021 | $6,339 | $458,000 | $187,600 | $270,400 |
| 2020 | $6,431 | $473,600 | $187,600 | $286,000 |
| 2019 | $5,907 | $429,600 | $178,700 | $250,900 |
| 2018 | $4,867 | $383,100 | $170,200 | $212,900 |
| 2017 | $4,867 | $336,800 | $162,100 | $174,700 |
| 2016 | $4,616 | $315,500 | $154,400 | $161,100 |
| 2015 | $4,397 | $306,000 | $154,400 | $151,600 |
| 2014 | $4,135 | $290,400 | $147,000 | $143,400 |
Source: Public Records
Map
Nearby Homes
- 14 Roberts Rd
- 11 Patchs Pond Ln
- 25 Sarah St
- 2 Winston Ave
- 29 Beaverbrook Rd
- 9 Upland Rd
- 15 Forest St
- 7 Cross St Unit 306
- 7 Cross St Unit 304
- 7 Cross St Unit 205
- 9 Parker St
- 61 Lowell St
- 27 Fairview Ave
- 21 Spring Valley Rd
- 17 Molloy Rd
- 1 Harvard Ave
- 44 Connolly Rd
- 2 Stephanie St
- 38 Freeport Dr
- 2 Cutting Ln