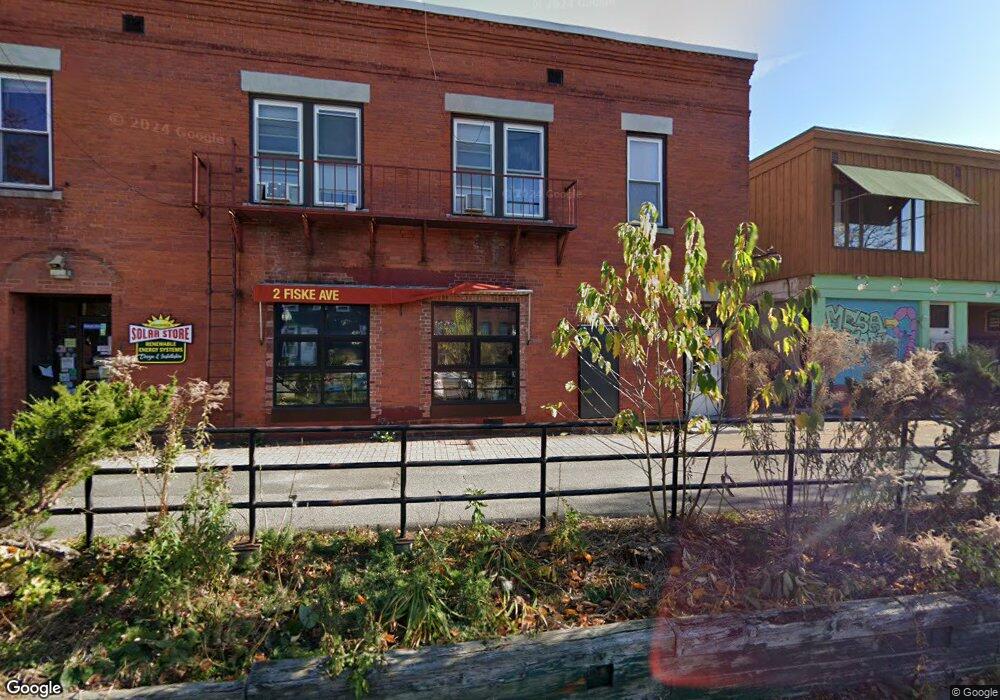
2 Fiske Ave Greenfield, MA 01301
Estimated Value: $330,709
3
Beds
3
Baths
4,982
Sq Ft
$66/Sq Ft
Est. Value
About This Home
This home is located at 2 Fiske Ave, Greenfield, MA 01301 and is currently estimated at $330,709, approximately $66 per square foot. 2 Fiske Ave is a home located in Franklin County.
Ownership History
Date
Name
Owned For
Owner Type
Purchase Details
Closed on
Dec 4, 2017
Sold by
Schechterle Steven J and Schechterle Debra L
Bought by
Gyaltsen Dolkar and Gyaltsen Yeshi
Current Estimated Value
Home Financials for this Owner
Home Financials are based on the most recent Mortgage that was taken out on this home.
Original Mortgage
$175,000
Outstanding Balance
$146,409
Interest Rate
3.88%
Mortgage Type
New Conventional
Estimated Equity
$184,300
Purchase Details
Closed on
Apr 12, 2004
Sold by
Mason John R
Bought by
Schechterle Debra L and David Wells R
Create a Home Valuation Report for This Property
The Home Valuation Report is an in-depth analysis detailing your home's value as well as a comparison with similar homes in the area
Home Values in the Area
Average Home Value in this Area
Purchase History
| Date | Buyer | Sale Price | Title Company |
|---|---|---|---|
| Gyaltsen Dolkar | $180,000 | -- | |
| Gyaltsen Dolkar | $180,000 | -- | |
| Schechterle Debra L | -- | -- | |
| Mason John R | -- | -- | |
| Mason John R | -- | -- |
Source: Public Records
Mortgage History
| Date | Status | Borrower | Loan Amount |
|---|---|---|---|
| Open | Gyaltsen Dolkar | $175,000 | |
| Closed | Gyaltsen Dolkar | $175,000 | |
| Previous Owner | Mason John R | $70,000 |
Source: Public Records
Tax History Compared to Growth
Tax History
| Year | Tax Paid | Tax Assessment Tax Assessment Total Assessment is a certain percentage of the fair market value that is determined by local assessors to be the total taxable value of land and additions on the property. | Land | Improvement |
|---|---|---|---|---|
| 2025 | $4,442 | $227,100 | $88,100 | $139,000 |
| 2024 | $4,545 | $222,900 | $83,900 | $139,000 |
| 2023 | $4,024 | $204,800 | $76,200 | $128,600 |
| 2022 | $4,444 | $199,100 | $72,600 | $126,500 |
| 2021 | $4,672 | $201,200 | $76,800 | $124,400 |
| 2020 | $4,517 | $197,000 | $76,800 | $120,200 |
| 2019 | $4,405 | $197,000 | $76,800 | $120,200 |
| 2018 | $4,089 | $182,300 | $70,400 | $111,900 |
| 2017 | $3,961 | $182,300 | $70,400 | $111,900 |
| 2016 | $3,930 | $180,200 | $70,400 | $109,800 |
| 2015 | $3,910 | $173,700 | $68,300 | $105,400 |
| 2014 | $3,615 | $176,100 | $68,300 | $107,800 |
Source: Public Records
Map
Nearby Homes