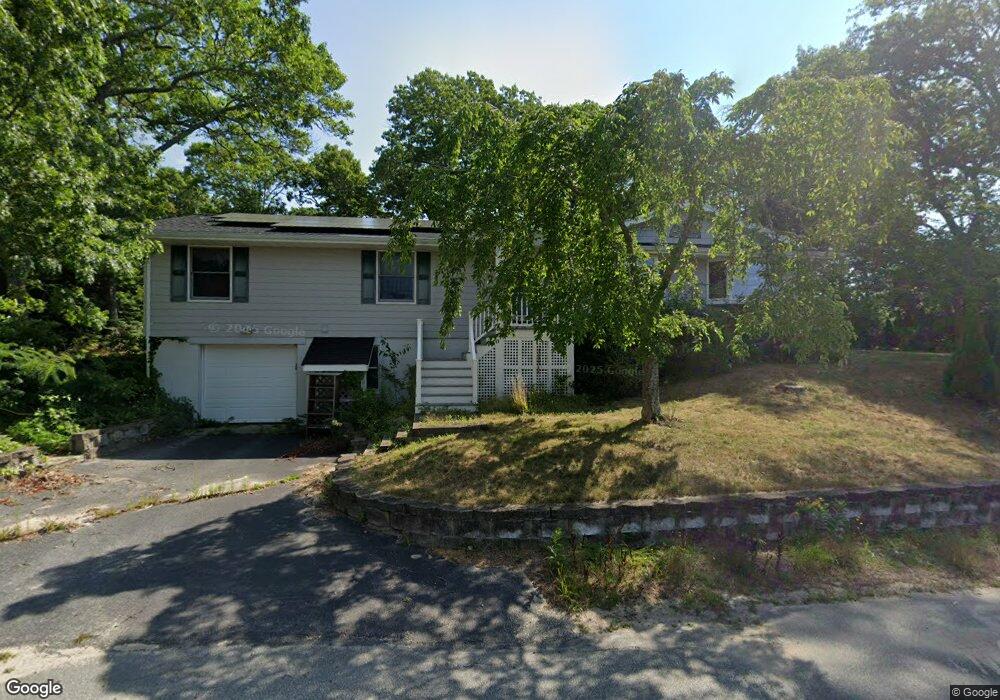
2 Franconia Ave Wareham, MA 02571
Wareham Center NeighborhoodEstimated Value: $544,000 - $731,000
2
Beds
2
Baths
1,656
Sq Ft
$367/Sq Ft
Est. Value
About This Home
This home is located at 2 Franconia Ave, Wareham, MA 02571 and is currently estimated at $607,973, approximately $367 per square foot. 2 Franconia Ave is a home located in Plymouth County.
Ownership History
Date
Name
Owned For
Owner Type
Purchase Details
Closed on
Dec 22, 2022
Sold by
Russo Albert A Est and Russo
Bought by
Sheridan Philip H
Current Estimated Value
Home Financials for this Owner
Home Financials are based on the most recent Mortgage that was taken out on this home.
Original Mortgage
$419,796
Outstanding Balance
$407,085
Interest Rate
7.08%
Mortgage Type
Purchase Money Mortgage
Estimated Equity
$200,888
Purchase Details
Closed on
Jun 1, 1999
Sold by
Bello Leonard M
Bought by
Russo Albert A and Russo Carolyn B
Home Financials for this Owner
Home Financials are based on the most recent Mortgage that was taken out on this home.
Original Mortgage
$85,600
Interest Rate
6.82%
Mortgage Type
Purchase Money Mortgage
Create a Home Valuation Report for This Property
The Home Valuation Report is an in-depth analysis detailing your home's value as well as a comparison with similar homes in the area
Home Values in the Area
Average Home Value in this Area
Purchase History
| Date | Buyer | Sale Price | Title Company |
|---|---|---|---|
| Sheridan Philip H | $460,000 | None Available | |
| Sheridan Philip H | $460,000 | None Available | |
| Russo Albert A | $107,000 | -- | |
| Russo Albert A | $107,000 | -- |
Source: Public Records
Mortgage History
| Date | Status | Borrower | Loan Amount |
|---|---|---|---|
| Open | Sheridan Philip H | $419,796 | |
| Closed | Sheridan Philip H | $419,796 | |
| Previous Owner | Russo Albert A | $270,000 | |
| Previous Owner | Russo Albert A | $256,100 | |
| Previous Owner | Russo Albert A | $85,600 |
Source: Public Records
Tax History
| Year | Tax Paid | Tax Assessment Tax Assessment Total Assessment is a certain percentage of the fair market value that is determined by local assessors to be the total taxable value of land and additions on the property. | Land | Improvement |
|---|---|---|---|---|
| 2025 | $5,209 | $499,900 | $122,600 | $377,300 |
| 2024 | $5,178 | $461,100 | $96,400 | $364,700 |
| 2023 | $4,973 | $413,400 | $87,500 | $325,900 |
| 2022 | $4,631 | $351,400 | $87,500 | $263,900 |
| 2021 | $4,569 | $339,700 | $87,500 | $252,200 |
| 2020 | $4,247 | $320,300 | $87,500 | $232,800 |
| 2019 | $3,948 | $297,100 | $78,500 | $218,600 |
| 2018 | $3,691 | $270,800 | $78,500 | $192,300 |
| 2017 | $3,189 | $237,100 | $78,500 | $158,600 |
| 2016 | $2,924 | $216,100 | $78,000 | $138,100 |
| 2015 | $2,824 | $216,100 | $78,000 | $138,100 |
| 2014 | $2,841 | $221,100 | $74,100 | $147,000 |
Source: Public Records
Map
Nearby Homes
- 1 Nimrod Way
- 15 Broadmarsh Ave
- 6 Allen Ave
- 10 Oak St
- 12 Oakdale St
- 20 Grant St
- 43 Shore Ave
- 6 Wildwood Ave
- 10 Longmeadow Dr
- 6 Bourne Terrace
- 21 Bayview St
- 110 Mayflower Ridge Dr
- 437 Main St
- 10 Barnes St
- 233 Marion Rd
- 58 Shady Ln
- 2645 Cranberry Hwy Unit A
- 2697 Cranberry Hwy Unit 21
- 9 Woodville Way
- 156 Sandwich Rd
Your Personal Tour Guide
Ask me questions while you tour the home.