Estimated Value: $1,264,000 - $1,396,000
3
Beds
3
Baths
1,559
Sq Ft
$861/Sq Ft
Est. Value
About This Home
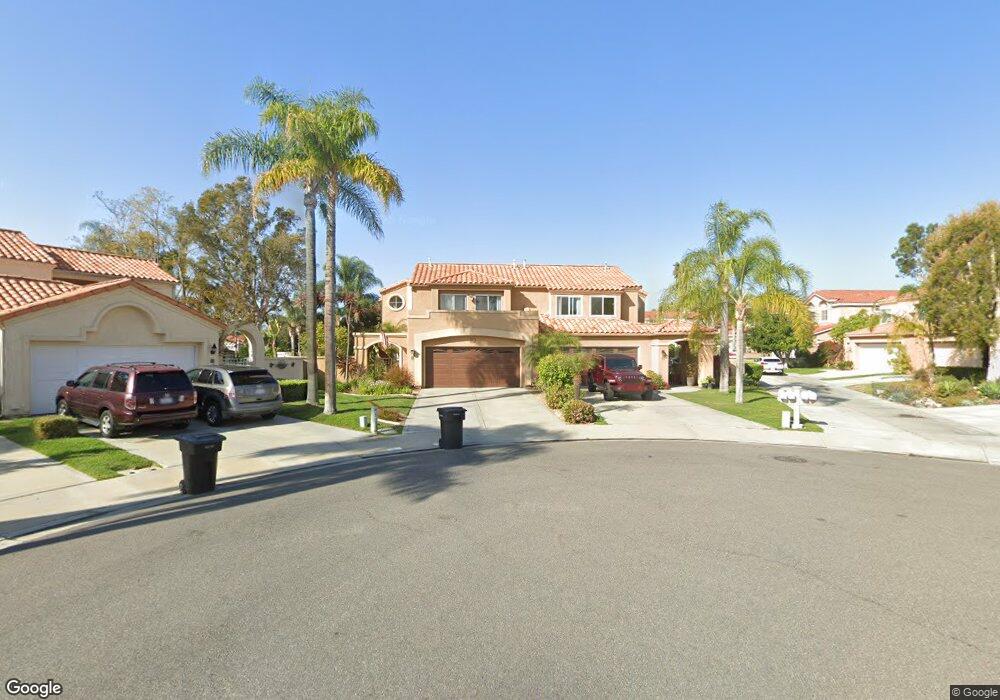
This home is located at 2 Genoa, Laguna Niguel, CA 92677 and is currently estimated at $1,343,035, approximately $861 per square foot. 2 Genoa is a home located in Orange County with nearby schools including Hidden Hills Elementary, Niguel Hills Middle School, and Dana Hills High School.
Ownership History
Date
Name
Owned For
Owner Type
Purchase Details
Closed on
Apr 13, 2006
Sold by
Torrance John R
Bought by
Vujovich Paul and Vujovich Alicia
Current Estimated Value
Home Financials for this Owner
Home Financials are based on the most recent Mortgage that was taken out on this home.
Original Mortgage
$576,000
Outstanding Balance
$331,198
Interest Rate
6.37%
Mortgage Type
Negative Amortization
Estimated Equity
$1,011,837
Purchase Details
Closed on
Jun 8, 1999
Sold by
Susan Motal
Bought by
Torrance John R
Home Financials for this Owner
Home Financials are based on the most recent Mortgage that was taken out on this home.
Original Mortgage
$90,000
Interest Rate
7.05%
Purchase Details
Closed on
May 16, 1998
Sold by
Hassan Alkhawaja
Bought by
Motal Susan
Create a Home Valuation Report for This Property
The Home Valuation Report is an in-depth analysis detailing your home's value as well as a comparison with similar homes in the area
Home Values in the Area
Average Home Value in this Area
Purchase History
| Date | Buyer | Sale Price | Title Company |
|---|---|---|---|
| Vujovich Paul | $720,000 | Chicago Title Co | |
| Torrance John R | $271,000 | California Counties Title Co | |
| Motal Susan | -- | -- |
Source: Public Records
Mortgage History
| Date | Status | Borrower | Loan Amount |
|---|---|---|---|
| Open | Vujovich Paul | $576,000 | |
| Previous Owner | Torrance John R | $90,000 |
Source: Public Records
Tax History Compared to Growth
Tax History
| Year | Tax Paid | Tax Assessment Tax Assessment Total Assessment is a certain percentage of the fair market value that is determined by local assessors to be the total taxable value of land and additions on the property. | Land | Improvement |
|---|---|---|---|---|
| 2025 | $9,778 | $983,930 | $697,840 | $286,090 |
| 2024 | $9,778 | $964,638 | $684,157 | $280,481 |
| 2023 | $9,109 | $900,000 | $670,742 | $229,258 |
| 2022 | $8,544 | $843,540 | $621,373 | $222,167 |
| 2021 | $8,379 | $827,000 | $609,189 | $217,811 |
| 2020 | $7,600 | $749,700 | $531,889 | $217,811 |
| 2019 | $7,450 | $735,000 | $521,459 | $213,541 |
| 2018 | $7,453 | $735,000 | $521,459 | $213,541 |
| 2017 | $7,453 | $735,000 | $521,459 | $213,541 |
| 2016 | $6,890 | $679,000 | $465,459 | $213,541 |
| 2015 | $6,383 | $629,000 | $415,459 | $213,541 |
| 2014 | $5,882 | $579,256 | $365,715 | $213,541 |
Source: Public Records
Map
Nearby Homes