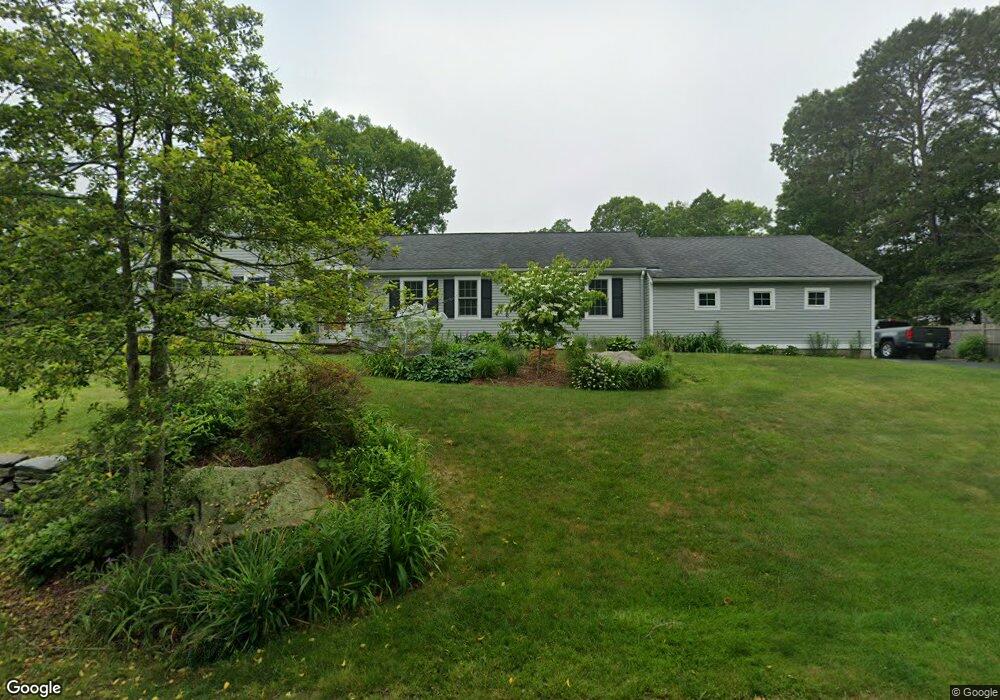
2 George St Sandwich, MA 02563
Estimated Value: $666,000 - $726,000
3
Beds
2
Baths
1,801
Sq Ft
$383/Sq Ft
Est. Value
About This Home
This home is located at 2 George St, Sandwich, MA 02563 and is currently estimated at $688,972, approximately $382 per square foot. 2 George St is a home located in Barnstable County with nearby schools including Sandwich Middle High School, Waldorf School of Cape Cod, and Bridgeview Montessori School.
Ownership History
Date
Name
Owned For
Owner Type
Purchase Details
Closed on
Aug 22, 2024
Sold by
Manning Edward W and Manning Catherine E
Bought by
Manning Ret and Manning
Current Estimated Value
Purchase Details
Closed on
Jun 30, 1998
Sold by
Hartshorn Bruce R and Kirby Meryden
Bought by
Manning Edawrd W and Manning Catherine E
Purchase Details
Closed on
Dec 28, 1990
Sold by
Tilton Peter C
Bought by
Hartshorn Bruce R
Purchase Details
Closed on
Sep 27, 1988
Sold by
Penswick Wm J P
Bought by
Filton Peter C
Create a Home Valuation Report for This Property
The Home Valuation Report is an in-depth analysis detailing your home's value as well as a comparison with similar homes in the area
Purchase History
| Date | Buyer | Sale Price | Title Company |
|---|---|---|---|
| Manning Ret | -- | None Available | |
| Manning Ret | -- | None Available | |
| Manning Edawrd W | $140,000 | -- | |
| Hartshorn Bruce R | $149,500 | -- | |
| Manning Edawrd W | $140,000 | -- | |
| Hartshorn Bruce R | $149,500 | -- | |
| Filton Peter C | $178,000 | -- |
Source: Public Records
Mortgage History
| Date | Status | Borrower | Loan Amount |
|---|---|---|---|
| Previous Owner | Filton Peter C | $236,250 | |
| Previous Owner | Filton Peter C | $215,550 |
Source: Public Records
Tax History
| Year | Tax Paid | Tax Assessment Tax Assessment Total Assessment is a certain percentage of the fair market value that is determined by local assessors to be the total taxable value of land and additions on the property. | Land | Improvement |
|---|---|---|---|---|
| 2025 | $6,150 | $581,800 | $222,600 | $359,200 |
| 2024 | $5,816 | $538,500 | $198,800 | $339,700 |
| 2023 | $5,391 | $468,800 | $154,900 | $313,900 |
| 2022 | $5,175 | $393,200 | $138,300 | $254,900 |
| 2021 | $3,313 | $361,600 | $133,000 | $228,600 |
| 2020 | $5,039 | $352,100 | $135,300 | $216,800 |
| 2019 | $4,726 | $330,000 | $127,500 | $202,500 |
| 2018 | $2,762 | $304,700 | $123,100 | $181,600 |
| 2017 | $4,309 | $288,600 | $119,200 | $169,400 |
| 2016 | $4,026 | $278,200 | $113,100 | $165,100 |
| 2015 | $3,910 | $263,800 | $101,800 | $162,000 |
Source: Public Records
Map
Nearby Homes
- 21 Seneca Ln
- 5 Pine St
- 71 Tupper Rd
- 16 Town Neck Rd
- 6 Burg Ave
- 12 Burg Ave
- 107 Knott Ave
- 53 Dillingham Ave
- 78 Highview Dr
- 33 Highview Dr Unit 33
- 71 Dillingham Ave
- 3 Boardwalk Rd
- 7 Sunrise Ln
- 3 Hilltop Dr Unit 3
- 51 Commonwealth Ave
- 51 Commonwealth Ave
- 2 Freeman Ave
- 4 Freeman Ave
- 12 Freeman Ave
- 14 Freeman Ave
Your Personal Tour Guide
Ask me questions while you tour the home.