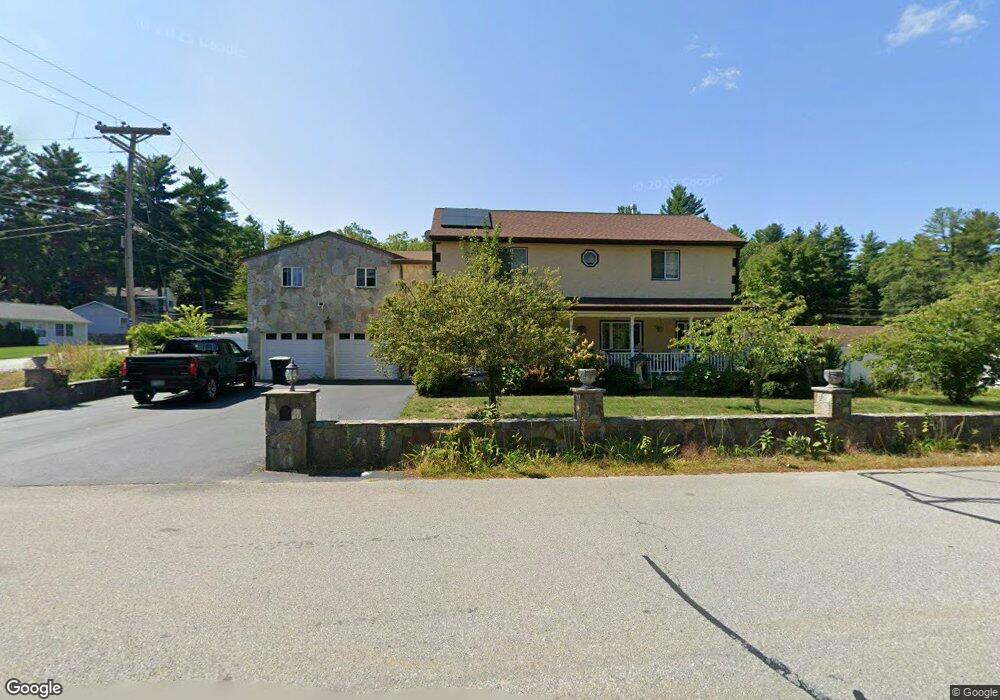
2 Greenwood Dr Nashua, NH 03062
Southwest Nashua NeighborhoodEstimated Value: $676,000 - $779,000
4
Beds
4
Baths
2,840
Sq Ft
$252/Sq Ft
Est. Value
About This Home
This home is located at 2 Greenwood Dr, Nashua, NH 03062 and is currently estimated at $716,467, approximately $252 per square foot. 2 Greenwood Dr is a home located in Hillsborough County with nearby schools including New Searles School, Fairgrounds Middle School, and Nashua High School South.
Ownership History
Date
Name
Owned For
Owner Type
Purchase Details
Closed on
Dec 20, 2018
Sold by
Conway Greenwood Llc
Bought by
Mattan Development Group
Current Estimated Value
Purchase Details
Closed on
Jul 27, 2006
Sold by
Shultz Lisa M
Bought by
Vondoellinger Maria
Home Financials for this Owner
Home Financials are based on the most recent Mortgage that was taken out on this home.
Original Mortgage
$292,500
Interest Rate
6.67%
Mortgage Type
Purchase Money Mortgage
Purchase Details
Closed on
Jul 10, 2002
Sold by
Woodgreen Lp
Bought by
Oconnor Stephen W
Purchase Details
Closed on
Dec 1, 1998
Sold by
Petty Anne G
Bought by
Semsettin Gorsan and Semsettin Marika
Create a Home Valuation Report for This Property
The Home Valuation Report is an in-depth analysis detailing your home's value as well as a comparison with similar homes in the area
Home Values in the Area
Average Home Value in this Area
Purchase History
| Date | Buyer | Sale Price | Title Company |
|---|---|---|---|
| Mattan Development Group | $156,000 | -- | |
| Vondoellinger Maria | $295,000 | -- | |
| Oconnor Stephen W | $107,900 | -- | |
| Semsettin Gorsan | $64,500 | -- |
Source: Public Records
Mortgage History
| Date | Status | Borrower | Loan Amount |
|---|---|---|---|
| Previous Owner | Semsettin Gorsan | $278,334 | |
| Previous Owner | Semsettin Gorsan | $300,000 | |
| Previous Owner | Semsettin Gorsan | $292,500 |
Source: Public Records
Tax History Compared to Growth
Tax History
| Year | Tax Paid | Tax Assessment Tax Assessment Total Assessment is a certain percentage of the fair market value that is determined by local assessors to be the total taxable value of land and additions on the property. | Land | Improvement |
|---|---|---|---|---|
| 2024 | $10,195 | $641,200 | $163,000 | $478,200 |
| 2023 | $9,656 | $529,700 | $130,400 | $399,300 |
| 2022 | $9,572 | $529,700 | $130,400 | $399,300 |
| 2021 | $8,559 | $368,600 | $86,900 | $281,700 |
| 2020 | $8,334 | $368,600 | $86,900 | $281,700 |
| 2019 | $8,021 | $368,600 | $86,900 | $281,700 |
| 2018 | $7,818 | $368,600 | $86,900 | $281,700 |
| 2017 | $8,423 | $326,600 | $67,600 | $259,000 |
| 2016 | $8,188 | $326,600 | $67,600 | $259,000 |
| 2015 | $7,950 | $324,100 | $67,600 | $256,500 |
| 2014 | $7,795 | $324,100 | $67,600 | $256,500 |
Source: Public Records
Map
Nearby Homes
- 29 Greenwood Dr
- 33 Cannon Dr
- 23 Glen Dr
- 57 Wethersfield Rd
- 5 Appaloosa Place
- 29 Dickens St
- 4 Henry David Dr Unit 203
- 9 Byron Dr
- 5 Wilderness Dr
- 17 Herrick St
- 15 Westray Dr
- 31 Tenby Dr
- 63 Dexter St
- 125 Lille Rd
- 15 Learned St Unit 123
- 61 Spindlewick Dr
- 6 Hayden St
- 97 Linwood St
- 11 Bordeaux St
- 22 Kern Dr