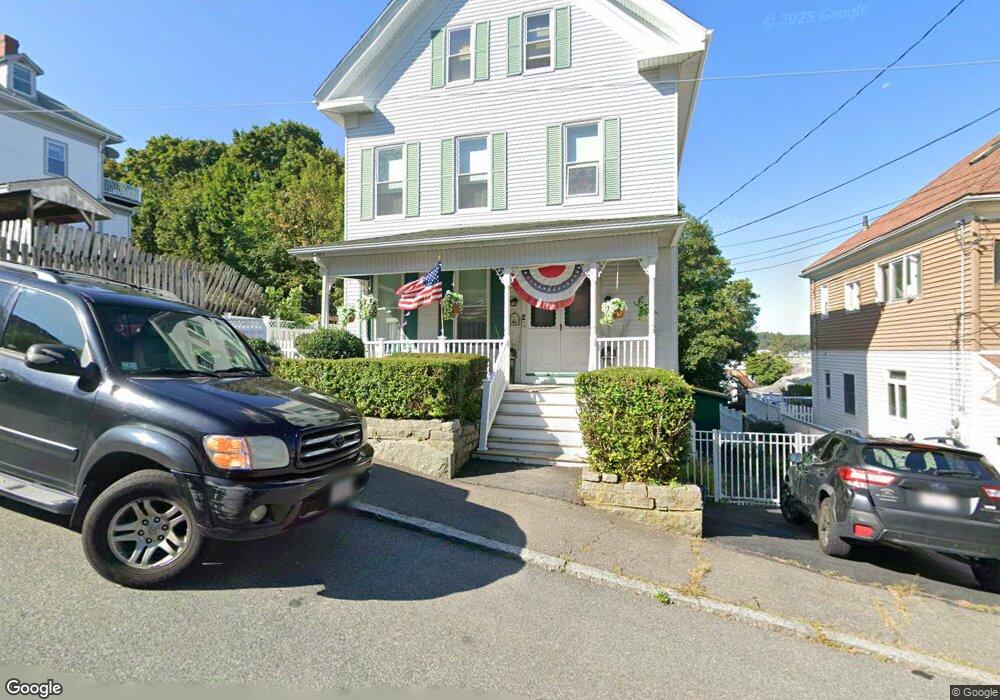
2 Hampden St Gloucester, MA 01930
Central Gloucester NeighborhoodEstimated Value: $490,000 - $725,000
2
Beds
2
Baths
2,059
Sq Ft
$300/Sq Ft
Est. Value
About This Home
This home is located at 2 Hampden St, Gloucester, MA 01930 and is currently estimated at $618,315, approximately $300 per square foot. 2 Hampden St is a home located in Essex County with nearby schools including West Parish, Ralph B O'maley Middle School, and Gloucester High School.
Ownership History
Date
Name
Owned For
Owner Type
Purchase Details
Closed on
May 7, 2025
Sold by
Lupo Ft and Lupo
Bought by
Lupo Ft and Lupo
Current Estimated Value
Purchase Details
Closed on
Jul 19, 2019
Sold by
Lupo Michele L
Bought by
Lupo Ft
Purchase Details
Closed on
Apr 23, 2015
Sold by
Lupo Thomas and Lupo Michele
Bought by
Lupo Michele L
Purchase Details
Closed on
Oct 1, 1968
Bought by
Lupo Thomas and Lupo Michele
Create a Home Valuation Report for This Property
The Home Valuation Report is an in-depth analysis detailing your home's value as well as a comparison with similar homes in the area
Home Values in the Area
Average Home Value in this Area
Purchase History
| Date | Buyer | Sale Price | Title Company |
|---|---|---|---|
| Lupo Ft | -- | None Available | |
| Lupo Ft | -- | None Available | |
| Lupo Ft | -- | None Available | |
| Lupo Ft | -- | -- | |
| Lupo Ft | -- | -- | |
| Lupo Ft | -- | -- | |
| Lupo Michele L | -- | -- | |
| Lupo Michele L | -- | -- | |
| Lupo Thomas | -- | -- |
Source: Public Records
Mortgage History
| Date | Status | Borrower | Loan Amount |
|---|---|---|---|
| Previous Owner | Lupo Thomas | $80,000 | |
| Previous Owner | Lupo Thomas | $49,000 |
Source: Public Records
Tax History
| Year | Tax Paid | Tax Assessment Tax Assessment Total Assessment is a certain percentage of the fair market value that is determined by local assessors to be the total taxable value of land and additions on the property. | Land | Improvement |
|---|---|---|---|---|
| 2025 | $5,136 | $528,400 | $143,200 | $385,200 |
| 2024 | $5,040 | $518,000 | $136,400 | $381,600 |
| 2023 | $5,199 | $490,900 | $121,800 | $369,100 |
| 2022 | $4,876 | $415,700 | $105,900 | $309,800 |
| 2021 | $4,717 | $379,200 | $96,300 | $282,900 |
| 2020 | $4,477 | $363,100 | $96,300 | $266,800 |
| 2019 | $4,175 | $329,000 | $96,300 | $232,700 |
| 2018 | $3,905 | $302,000 | $96,300 | $205,700 |
| 2017 | $3,634 | $275,500 | $86,700 | $188,800 |
| 2016 | $3,499 | $257,100 | $86,700 | $170,400 |
| 2015 | $3,436 | $251,700 | $86,700 | $165,000 |
Source: Public Records
Map
Nearby Homes
- 55 Mansfield St Unit A
- 55 Mansfield St Unit B
- 55 Mansfield St
- 20 Beacon St Unit 2
- 20 Beacon St Unit 1
- 84 Centennial Ave
- 33 Middle St
- 15 Harvard St
- 33 Maplewood Ave Unit 16
- 191 Main St Unit 3
- 191 Main St Unit 2A
- 5 Marshfield St
- 113 Pleasant St
- 6 Monroe Ct
- 98 Maplewood Ave
- 40 Sargent St
- 13 Mystic Ave
- 19 Trask St Unit 2
- 160 Prospect St Unit 3
- 73 Rocky Neck Ave Unit 2
Your Personal Tour Guide
Ask me questions while you tour the home.