Estimated Value: $516,000 - $635,000
1
Bed
1
Bath
941
Sq Ft
$620/Sq Ft
Est. Value
About This Home
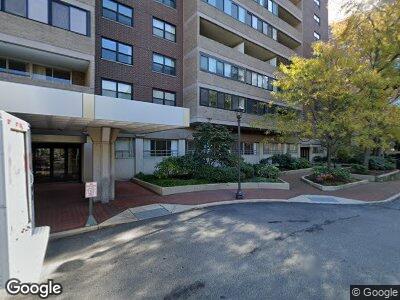
This home is located at 2 Hawthorne Place Unit 15A, Boston, MA 02114 and is currently estimated at $583,613, approximately $620 per square foot. 2 Hawthorne Place Unit 15A is a home located in Suffolk County with nearby schools including Torit Montessori School, Boston Children's School, and Advent School.
Ownership History
Date
Name
Owned For
Owner Type
Purchase Details
Closed on
Mar 8, 2019
Sold by
Duke Ryan C
Bought by
Ryan C Duke Ft
Current Estimated Value
Purchase Details
Closed on
Oct 21, 2008
Sold by
Duke Patrick and Duke Michele S
Bought by
Duke Michele S and Duke Ryan C
Home Financials for this Owner
Home Financials are based on the most recent Mortgage that was taken out on this home.
Original Mortgage
$304,000
Interest Rate
6.41%
Mortgage Type
Purchase Money Mortgage
Purchase Details
Closed on
Aug 25, 2003
Sold by
Witherby Anne Br
Bought by
Martelo Amanda and Leib Jesse
Home Financials for this Owner
Home Financials are based on the most recent Mortgage that was taken out on this home.
Original Mortgage
$316,000
Interest Rate
5.52%
Mortgage Type
Purchase Money Mortgage
Purchase Details
Closed on
Mar 8, 2001
Sold by
Barrett Corinne M
Bought by
Witherby Ann B
Create a Home Valuation Report for This Property
The Home Valuation Report is an in-depth analysis detailing your home's value as well as a comparison with similar homes in the area
Home Values in the Area
Average Home Value in this Area
Purchase History
| Date | Buyer | Sale Price | Title Company |
|---|---|---|---|
| Ryan C Duke Ft | -- | -- | |
| Duke Ryan C | -- | -- | |
| Duke Michele S | -- | -- | |
| Martelo Amanda | $333,000 | -- | |
| Witherby Ann B | $350,000 | -- |
Source: Public Records
Mortgage History
| Date | Status | Borrower | Loan Amount |
|---|---|---|---|
| Previous Owner | Duke Ryan C | $245,500 | |
| Previous Owner | Witherby Ann B | $304,000 | |
| Previous Owner | Duke Michele S | $304,000 | |
| Previous Owner | Witherby Ann B | $330,000 | |
| Previous Owner | Witherby Ann B | $316,000 |
Source: Public Records
Tax History Compared to Growth
Tax History
| Year | Tax Paid | Tax Assessment Tax Assessment Total Assessment is a certain percentage of the fair market value that is determined by local assessors to be the total taxable value of land and additions on the property. | Land | Improvement |
|---|---|---|---|---|
| 2025 | $6,450 | $557,000 | $0 | $557,000 |
| 2024 | $6,375 | $584,900 | $0 | $584,900 |
| 2023 | $6,282 | $584,900 | $0 | $584,900 |
| 2022 | $6,301 | $579,100 | $0 | $579,100 |
| 2021 | $6,179 | $579,100 | $0 | $579,100 |
| 2020 | $5,899 | $558,600 | $0 | $558,600 |
| 2019 | $5,605 | $531,800 | $0 | $531,800 |
| 2018 | $5,260 | $501,900 | $0 | $501,900 |
| 2017 | $5,060 | $477,800 | $0 | $477,800 |
| 2016 | $4,912 | $446,500 | $0 | $446,500 |
| 2015 | $5,609 | $463,191 | $0 | $463,191 |
| 2014 | $5,395 | $428,881 | $0 | $428,881 |
Source: Public Records
About This Building
Map
Nearby Homes
- 2 Hawthorne Place Unit 15M
- 2 Hawthorne Place Unit 14N
- 2 Hawthorne Place Unit 11M
- 2 Hawthorne Place Unit 6D
- 2 Hawthorne Place Unit 8O
- 2 Hawthorne Place Unit 4K
- 2 Hawthorne Place Unit 6G
- 2 Hawthorne Place Unit 2-O
- 9 Hawthorne Place
- 9 Hawthorne Place Unit 7O
- 6 Whittier Place
- 6-8 Whittier Pl Pspot 231
- 150 Staniford St Unit 704
- 150 Staniford St Unit 520
- 8 Whittier Place Unit 16B
- 8 Whittier Place Unit 6C
- 8 Whittier Place Unit 18E
- 8 Whittier Place Unit 17E
- 8 Whittier Place Unit 22B
- 6 Whittier Place Unit 3G
- 2 Hawthorne Place Unit 14C
- 2 Hawthorne Place Unit 5K
- 2 Hawthorne Place Unit 16F
- 2 Hawthorne Place Unit 5B
- 2 Hawthorne Place Unit 14L
- 2 Hawthorne Place Unit 16L
- 2 Hawthorne Place Unit 15-f
- 2 Hawthorne Place Unit 9 D
- 2 Hawthorne Place Unit 6R
- 2 Hawthorne Place Unit 11F
- 2 Hawthorne Place Unit 4J
- 2 Hawthorne Place Unit 15R
- 2 Hawthorne Place Unit 9H
- 2 Hawthorne Place Unit 11D
- 2 Hawthorne Place Unit 4B
- 2 Hawthorne Place Unit 16K
- 2 Hawthorne Place Unit 15A
- 2 Hawthorne Place Unit 11-C
- 2 Hawthorne Place Unit 9N
- 2 Hawthorne Place Unit 6B