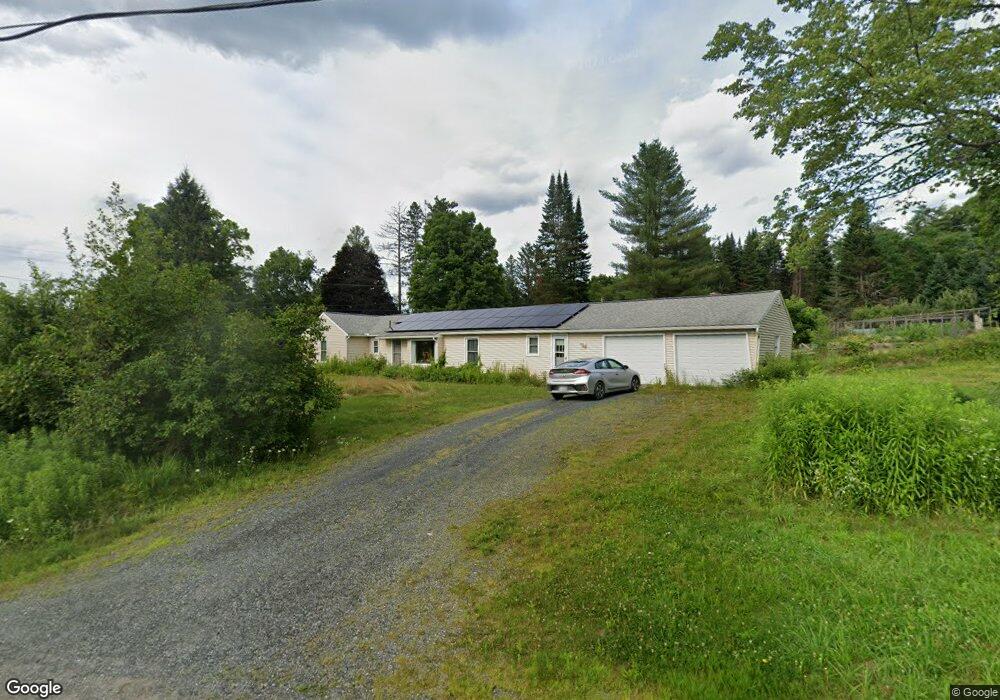
2 Hemlock Rd Hanover, NH 03755
Estimated Value: $889,213 - $1,470,000
4
Beds
3
Baths
1,929
Sq Ft
$558/Sq Ft
Est. Value
About This Home
This home is located at 2 Hemlock Rd, Hanover, NH 03755 and is currently estimated at $1,076,803, approximately $558 per square foot. 2 Hemlock Rd is a home located in Grafton County with nearby schools including Bernice A. Ray School, Frances C. Richmond School, and Hanover High School.
Ownership History
Date
Name
Owned For
Owner Type
Purchase Details
Closed on
May 1, 2023
Sold by
Devlin Peter
Bought by
Debra L Monticciolo Ret and Monticciolo
Current Estimated Value
Purchase Details
Closed on
Apr 25, 2022
Sold by
Coughlin Harold J
Bought by
Coughlin Harold J
Home Financials for this Owner
Home Financials are based on the most recent Mortgage that was taken out on this home.
Original Mortgage
$1,042,500
Interest Rate
4.3%
Mortgage Type
Reverse Mortgage Home Equity Conversion Mortgage
Purchase Details
Closed on
Apr 30, 2010
Sold by
Tabor-Coughlin Kathleen
Bought by
Coughlin Harold Joseph
Home Financials for this Owner
Home Financials are based on the most recent Mortgage that was taken out on this home.
Original Mortgage
$380,000
Interest Rate
4.99%
Mortgage Type
Purchase Money Mortgage
Create a Home Valuation Report for This Property
The Home Valuation Report is an in-depth analysis detailing your home's value as well as a comparison with similar homes in the area
Home Values in the Area
Average Home Value in this Area
Purchase History
| Date | Buyer | Sale Price | Title Company |
|---|---|---|---|
| Debra L Monticciolo Ret | $465,000 | None Available | |
| Coughlin Harold J | -- | None Available | |
| Coughlin Harold Joseph | $380,000 | -- | |
| Coughlin Harold Joseph | $380,000 | -- |
Source: Public Records
Mortgage History
| Date | Status | Borrower | Loan Amount |
|---|---|---|---|
| Previous Owner | Coughlin Harold J | $1,042,500 | |
| Previous Owner | Coughlin Harold Joseph | $380,000 |
Source: Public Records
Tax History
| Year | Tax Paid | Tax Assessment Tax Assessment Total Assessment is a certain percentage of the fair market value that is determined by local assessors to be the total taxable value of land and additions on the property. | Land | Improvement |
|---|---|---|---|---|
| 2024 | $12,038 | $624,700 | $351,100 | $273,600 |
| 2023 | $11,582 | $624,700 | $351,100 | $273,600 |
| 2022 | $11,231 | $631,300 | $351,100 | $280,200 |
| 2021 | $11,136 | $631,300 | $351,100 | $280,200 |
| 2020 | $9,788 | $484,300 | $300,700 | $183,600 |
| 2019 | $9,652 | $484,300 | $300,700 | $183,600 |
| 2018 | $9,313 | $484,300 | $300,700 | $183,600 |
| 2017 | $8,407 | $387,600 | $184,800 | $202,800 |
| 2016 | $8,252 | $387,600 | $184,800 | $202,800 |
| 2015 | $8,093 | $387,600 | $184,800 | $202,800 |
| 2014 | $7,764 | $387,600 | $184,800 | $202,800 |
| 2013 | $7,485 | $387,600 | $184,800 | $202,800 |
| 2012 | $7,651 | $413,800 | $193,800 | $220,000 |
Source: Public Records
Map
Nearby Homes
- 25 Hemlock Rd
- 3 Woodmore Dr
- 53 Lyme Rd Unit 35
- 68 Lyme Rd
- 0 and 2.5 Balch Hill Ln
- 4 Haskins Rd
- 51 Loveland Rd
- 0 U S 5
- 2 Hilton Field Ln
- 15 Melview Ridge
- 4 Occom Ridge
- 201 Hawk Pine Rd
- 1 O'Leary Ave
- 15 College Hill
- 27 College Hill Rd
- 16 College Hill Rd
- 85 Lebanon St
- 207 Willey Hill Rd
- 299 Farrell Farm Rd
- 23 School St
Your Personal Tour Guide
Ask me questions while you tour the home.