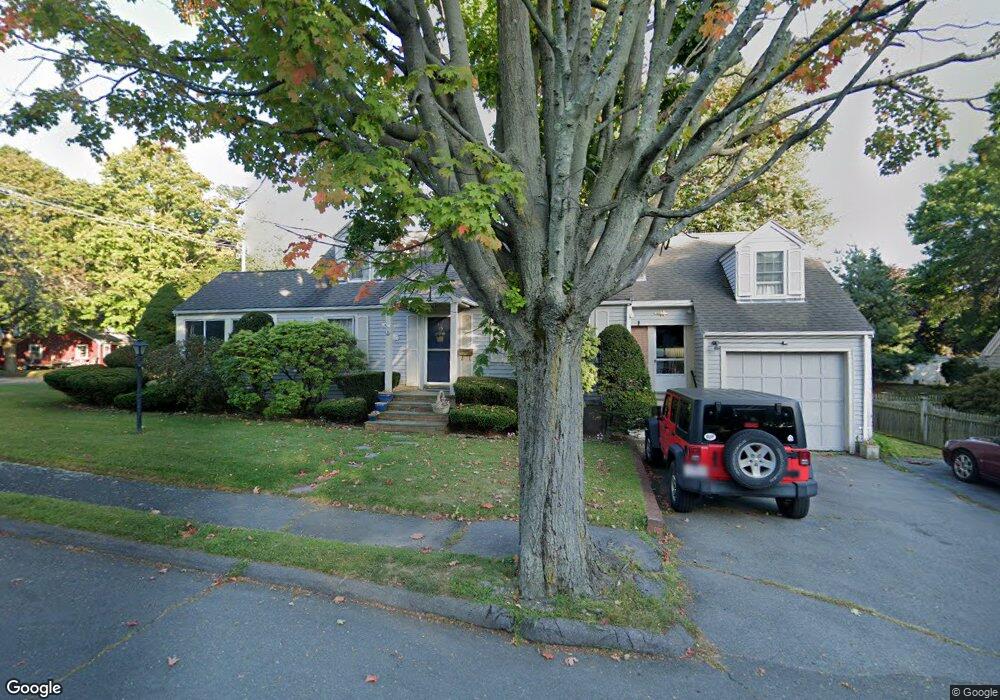
2 Hibbard Rd Marblehead, MA 01945
Estimated Value: $1,025,279 - $1,309,000
4
Beds
2
Baths
2,162
Sq Ft
$508/Sq Ft
Est. Value
About This Home
This home is located at 2 Hibbard Rd, Marblehead, MA 01945 and is currently estimated at $1,098,070, approximately $507 per square foot. 2 Hibbard Rd is a home located in Essex County with nearby schools including Marblehead High School, Marblehead Community Charter Public School, and Tower School.
Ownership History
Date
Name
Owned For
Owner Type
Purchase Details
Closed on
Jan 3, 1996
Sold by
Kent James K and Kent Phoebe W
Bought by
Collins Edward C and Collins Linda
Current Estimated Value
Home Financials for this Owner
Home Financials are based on the most recent Mortgage that was taken out on this home.
Original Mortgage
$230,000
Interest Rate
7.34%
Mortgage Type
Purchase Money Mortgage
Create a Home Valuation Report for This Property
The Home Valuation Report is an in-depth analysis detailing your home's value as well as a comparison with similar homes in the area
Home Values in the Area
Average Home Value in this Area
Purchase History
| Date | Buyer | Sale Price | Title Company |
|---|---|---|---|
| Collins Edward C | $264,000 | -- | |
| Collins Edward C | $264,000 | -- |
Source: Public Records
Mortgage History
| Date | Status | Borrower | Loan Amount |
|---|---|---|---|
| Closed | Collins Edward C | $160,000 | |
| Closed | Collins Edward C | $30,000 | |
| Closed | Collins Edward C | $225,000 | |
| Closed | Collins Edward C | $230,000 |
Source: Public Records
Tax History Compared to Growth
Tax History
| Year | Tax Paid | Tax Assessment Tax Assessment Total Assessment is a certain percentage of the fair market value that is determined by local assessors to be the total taxable value of land and additions on the property. | Land | Improvement |
|---|---|---|---|---|
| 2025 | $7,655 | $845,900 | $506,000 | $339,900 |
| 2024 | $6,801 | $759,000 | $543,900 | $215,100 |
| 2023 | $7,150 | $715,000 | $474,400 | $240,600 |
| 2022 | $6,898 | $655,700 | $417,400 | $238,300 |
| 2021 | $6,701 | $643,100 | $404,800 | $238,300 |
| 2020 | $6,224 | $599,000 | $392,100 | $206,900 |
| 2019 | $6,137 | $571,400 | $366,800 | $204,600 |
| 2018 | $6,158 | $558,800 | $354,200 | $204,600 |
| 2017 | $5,734 | $520,800 | $316,200 | $204,600 |
| 2016 | $5,480 | $493,700 | $290,900 | $202,800 |
| 2015 | $5,181 | $467,600 | $278,300 | $189,300 |
| 2014 | $4,714 | $425,100 | $240,300 | $184,800 |
Source: Public Records
Map
Nearby Homes
- 89 Naugus Ave
- 2 Beacon Hill Rd
- 4 Broadmere Way
- 105 Green St Unit 4
- 51 Lincoln Ave
- 31 Lincoln Park
- 45 Peach Highlands
- 170 Jersey St
- 33 Intrepid Cir Unit 208
- 37 Peach Highlands
- 10 Shepard St
- 87 Jersey St
- 25 Curtis St
- 24-26 Knight Ave
- 66 Jersey St
- 215 W Shore Dr
- 3 Frost Ln Unit 1
- 197A W Shore Dr Unit A
- 155 Village St
- 1 Green St Unit 2