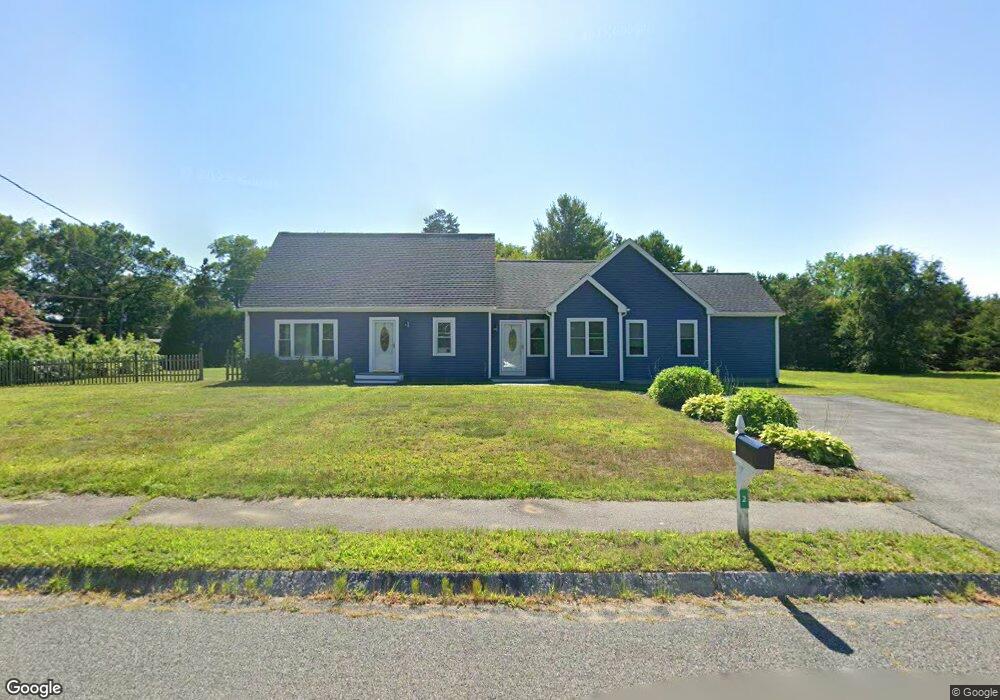
2 Hidden Ln Mansfield, MA 02048
Estimated Value: $609,000 - $762,000
3
Beds
2
Baths
2,179
Sq Ft
$316/Sq Ft
Est. Value
About This Home
This home is located at 2 Hidden Ln, Mansfield, MA 02048 and is currently estimated at $688,193, approximately $315 per square foot. 2 Hidden Ln is a home located in Bristol County with nearby schools including Everett W. Robinson Elementary School, Jordan/Jackson Elementary School, and Harold L. Qualters Middle School.
Ownership History
Date
Name
Owned For
Owner Type
Purchase Details
Closed on
Oct 22, 2004
Sold by
Barlow Cheryl A and Barlow Luke A
Bought by
Roche Donna M and Deveney Steven A
Current Estimated Value
Home Financials for this Owner
Home Financials are based on the most recent Mortgage that was taken out on this home.
Original Mortgage
$272,000
Outstanding Balance
$135,430
Interest Rate
5.85%
Mortgage Type
Purchase Money Mortgage
Estimated Equity
$552,763
Purchase Details
Closed on
Jul 17, 1995
Sold by
Mansfield Coop Bk
Bought by
Barlow Luke A and Barlow Cheryl A
Home Financials for this Owner
Home Financials are based on the most recent Mortgage that was taken out on this home.
Original Mortgage
$95,681
Interest Rate
7.7%
Mortgage Type
Purchase Money Mortgage
Purchase Details
Closed on
Dec 20, 1994
Sold by
Panagopoulos Charles M
Bought by
Mansfield Coop Bk
Create a Home Valuation Report for This Property
The Home Valuation Report is an in-depth analysis detailing your home's value as well as a comparison with similar homes in the area
Home Values in the Area
Average Home Value in this Area
Purchase History
| Date | Buyer | Sale Price | Title Company |
|---|---|---|---|
| Roche Donna M | $340,000 | -- | |
| Barlow Luke A | $105,000 | -- | |
| Mansfield Coop Bk | $80,000 | -- |
Source: Public Records
Mortgage History
| Date | Status | Borrower | Loan Amount |
|---|---|---|---|
| Open | Roche Donna M | $272,000 | |
| Previous Owner | Mansfield Coop Bk | $15,000 | |
| Previous Owner | Mansfield Coop Bk | $95,681 | |
| Previous Owner | Mansfield Coop Bk | $97,000 |
Source: Public Records
Tax History
| Year | Tax Paid | Tax Assessment Tax Assessment Total Assessment is a certain percentage of the fair market value that is determined by local assessors to be the total taxable value of land and additions on the property. | Land | Improvement |
|---|---|---|---|---|
| 2025 | $8,376 | $636,000 | $266,800 | $369,200 |
| 2024 | $8,408 | $622,800 | $254,700 | $368,100 |
| 2023 | $8,275 | $587,300 | $254,700 | $332,600 |
| 2022 | $7,972 | $525,500 | $235,800 | $289,700 |
| 2021 | $1,561 | $510,900 | $224,600 | $286,300 |
| 2020 | $1,494 | $461,000 | $196,600 | $264,400 |
| 2019 | $7,147 | $469,600 | $187,100 | $282,500 |
| 2018 | $6,489 | $453,200 | $178,400 | $274,800 |
| 2017 | $6,346 | $422,500 | $173,400 | $249,100 |
| 2016 | $6,061 | $393,300 | $165,000 | $228,300 |
| 2015 | $6,017 | $388,200 | $165,000 | $223,200 |
Source: Public Records
Map
Nearby Homes
- 24 Maverick Dr
- 25 Shepherd St
- 25 Munroe Dr
- 84 Messenger St
- 9 Coach Rd
- 150 Gilbert St
- 128 Tremont St
- 17 Childs Ln
- 33 Colonial Way
- 57 Vine St
- 40 Treasure Island Rd
- 115 Westfield Dr
- 28 Messenger St
- 16 Treasure Island Rd
- Lot 5 Jeffrey Dr
- 14 Claire Ave
- Lot 2 Jeffrey Dr
- 46 Mirimichi St
- 38 Mirimichi St
- 401 South St
Your Personal Tour Guide
Ask me questions while you tour the home.