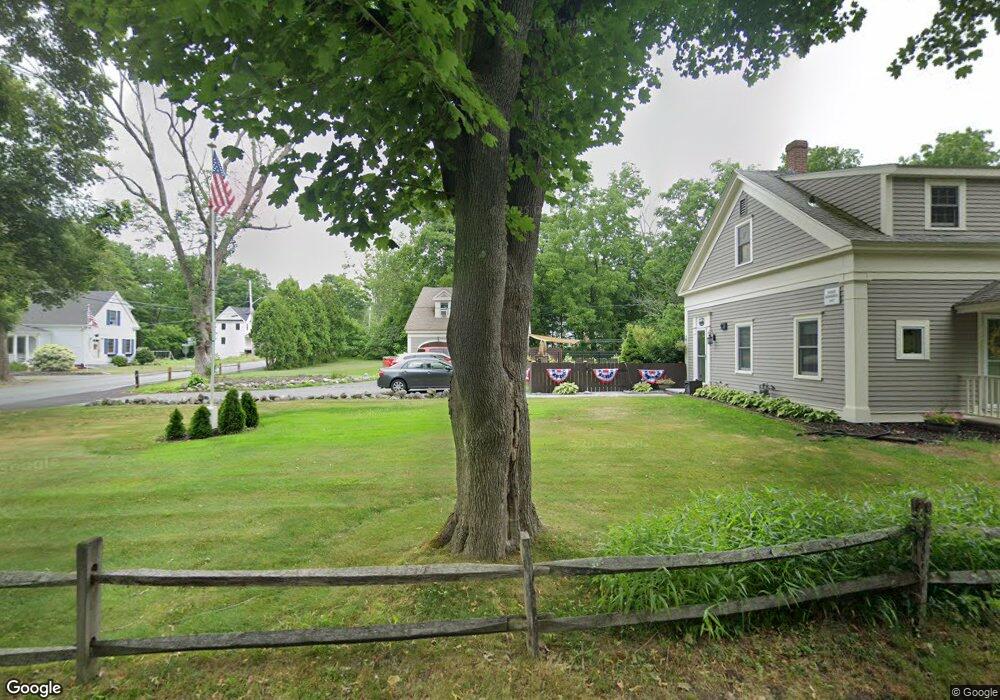
2 Hobart St East Bridgewater, MA 02333
Estimated Value: $630,000 - $731,000
3
Beds
2
Baths
2,004
Sq Ft
$331/Sq Ft
Est. Value
About This Home
This home is located at 2 Hobart St, East Bridgewater, MA 02333 and is currently estimated at $662,466, approximately $330 per square foot. 2 Hobart St is a home located in Plymouth County with nearby schools including Central Elementary School, Gordon W Mitchell Middle School, and East Bridgewater Jr./Sr. High School.
Ownership History
Date
Name
Owned For
Owner Type
Purchase Details
Closed on
Mar 30, 2007
Sold by
Flores Jennifer L
Bought by
Steele Kathleen O and Steele Lewis F
Current Estimated Value
Home Financials for this Owner
Home Financials are based on the most recent Mortgage that was taken out on this home.
Original Mortgage
$288,750
Interest Rate
6.33%
Mortgage Type
Purchase Money Mortgage
Purchase Details
Closed on
Dec 5, 2003
Sold by
Perkins Patricia A and Perkins John S
Bought by
Flores Jennifer L and Haas Jennifer S
Purchase Details
Closed on
Jun 30, 1999
Sold by
Nolan William J and Nolan Patricia A
Bought by
Perkins John S and Perkins Patricia A
Purchase Details
Closed on
Sep 24, 1993
Sold by
Rockland Sb
Bought by
Nolan William J and Nolan Patricia A
Purchase Details
Closed on
Feb 24, 1993
Sold by
Furness William B and Rockland Sb
Bought by
Rockland Sb
Create a Home Valuation Report for This Property
The Home Valuation Report is an in-depth analysis detailing your home's value as well as a comparison with similar homes in the area
Home Values in the Area
Average Home Value in this Area
Purchase History
| Date | Buyer | Sale Price | Title Company |
|---|---|---|---|
| Steele Kathleen O | $385,000 | -- | |
| Flores Jennifer L | $381,000 | -- | |
| Perkins John S | $219,000 | -- | |
| Nolan William J | $134,000 | -- | |
| Rockland Sb | $105,000 | -- |
Source: Public Records
Mortgage History
| Date | Status | Borrower | Loan Amount |
|---|---|---|---|
| Open | Rockland Sb | $279,355 | |
| Closed | Rockland Sb | $288,750 |
Source: Public Records
Tax History Compared to Growth
Tax History
| Year | Tax Paid | Tax Assessment Tax Assessment Total Assessment is a certain percentage of the fair market value that is determined by local assessors to be the total taxable value of land and additions on the property. | Land | Improvement |
|---|---|---|---|---|
| 2025 | $7,196 | $526,400 | $197,500 | $328,900 |
| 2024 | $7,061 | $510,200 | $189,900 | $320,300 |
| 2023 | $6,758 | $467,700 | $189,900 | $277,800 |
| 2022 | $6,808 | $436,400 | $172,700 | $263,700 |
| 2021 | $6,716 | $393,900 | $165,900 | $228,000 |
| 2020 | $6,676 | $386,100 | $159,600 | $226,500 |
| 2019 | $6,325 | $360,200 | $152,500 | $207,700 |
| 2018 | $6,288 | $350,100 | $152,500 | $197,600 |
| 2017 | $6,105 | $333,600 | $145,400 | $188,200 |
| 2016 | $5,938 | $327,000 | $145,400 | $181,600 |
| 2015 | $5,724 | $322,300 | $144,400 | $177,900 |
| 2014 | $5,571 | $320,700 | $141,400 | $179,300 |
Source: Public Records
Map
Nearby Homes
- 41 Bedford St
- 11 Harmony Crossing
- 71 Church St
- 11 Willow Ave
- 282 Spring St
- 9 Hemlock Dr
- 261 Plymouth St
- 14 Mountain Ash Rd
- 407 W Union St
- 585 N Bedford St
- 505 N Central St
- 416 Highland St
- 611 N Bedford St
- 446 Elm St
- 78 Crystal Water Dr
- 1 Simmons Place
- 217 Crystal Water Dr
- 590 Bedford St
- 455 Plymouth St
- 182 Crystal Water Dr Unit 182