Estimated Value: $367,000 - $388,000
2
Beds
2
Baths
1,054
Sq Ft
$362/Sq Ft
Est. Value
About This Home
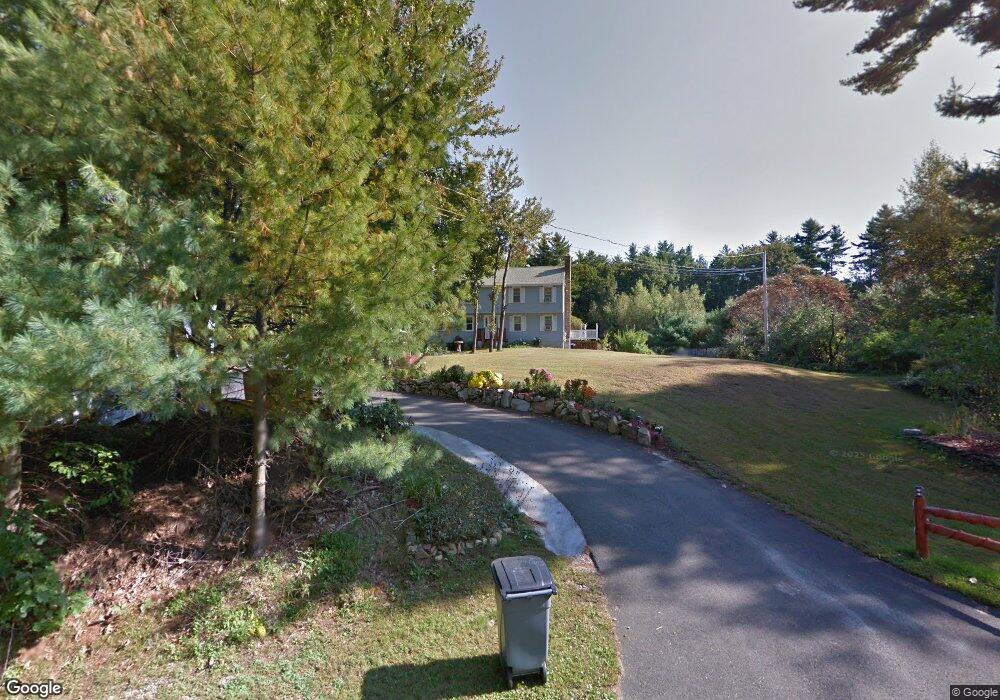
This home is located at 2 Homestead Dr Unit R, Derry, NH 03038 and is currently estimated at $381,235, approximately $361 per square foot. 2 Homestead Dr Unit R is a home located in Rockingham County with nearby schools including South Range Elementary School, West Running Brook Middle School, and Pinkerton Academy.
Ownership History
Date
Name
Owned For
Owner Type
Purchase Details
Closed on
Oct 1, 2015
Sold by
Vigeant Keith R and Vigeant Janet
Bought by
Vigeant Kenneth R and Vigeaut Kristina M
Current Estimated Value
Home Financials for this Owner
Home Financials are based on the most recent Mortgage that was taken out on this home.
Original Mortgage
$87,000
Outstanding Balance
$68,613
Interest Rate
3.95%
Estimated Equity
$312,622
Purchase Details
Closed on
Oct 2, 2013
Sold by
Bank New York Mellon T
Bought by
Vigeant Keith R and Vigeant Janet
Purchase Details
Closed on
Jul 24, 2013
Sold by
Lapierre Patricia
Bought by
Bank New York Mellon T
Purchase Details
Closed on
Sep 23, 2004
Sold by
Cresswell Karl J
Bought by
Lapierre Patricia
Home Financials for this Owner
Home Financials are based on the most recent Mortgage that was taken out on this home.
Original Mortgage
$133,600
Interest Rate
5.89%
Mortgage Type
Purchase Money Mortgage
Create a Home Valuation Report for This Property
The Home Valuation Report is an in-depth analysis detailing your home's value as well as a comparison with similar homes in the area
Home Values in the Area
Average Home Value in this Area
Purchase History
| Date | Buyer | Sale Price | Title Company |
|---|---|---|---|
| Vigeant Kenneth R | $100,000 | -- | |
| Vigeant Keith R | $100,000 | -- | |
| Bank New York Mellon T | $101,300 | -- | |
| Lapierre Patricia | $167,000 | -- |
Source: Public Records
Mortgage History
| Date | Status | Borrower | Loan Amount |
|---|---|---|---|
| Open | Vigeant Kenneth R | $87,000 | |
| Previous Owner | Lapierre Patricia | $133,600 |
Source: Public Records
Tax History Compared to Growth
Tax History
| Year | Tax Paid | Tax Assessment Tax Assessment Total Assessment is a certain percentage of the fair market value that is determined by local assessors to be the total taxable value of land and additions on the property. | Land | Improvement |
|---|---|---|---|---|
| 2024 | $5,915 | $316,500 | $0 | $316,500 |
| 2023 | $5,110 | $247,100 | $0 | $247,100 |
| 2022 | $4,705 | $247,100 | $0 | $247,100 |
| 2021 | $4,519 | $182,500 | $0 | $182,500 |
| 2020 | $4,442 | $182,500 | $0 | $182,500 |
| 2019 | $4,999 | $191,400 | $98,700 | $92,700 |
| 2018 | $5,046 | $187,600 | $98,700 | $88,900 |
| 2017 | $5,114 | $174,700 | $93,800 | $80,900 |
| 2016 | $4,457 | $164,700 | $93,800 | $70,900 |
| 2015 | $3,142 | $107,500 | $46,900 | $60,600 |
| 2014 | $3,163 | $107,500 | $46,900 | $60,600 |
| 2013 | $3,376 | $107,200 | $45,900 | $61,300 |
Source: Public Records
Map
Nearby Homes
- 5A Homestead Dr Unit A
- 5A Homestead Dr
- 13 Craven Terrace
- 56 Bedard Ave
- 22 Jacob Rd
- 2 Brown Rd
- 139 Rockingham Rd Unit 21
- 139 Rockingham Rd Unit 30
- 24 Alyssa Dr
- 242 Rockingham Rd
- 87 Island Pond Rd
- 26 Partridge Rd
- 144 Rockingham Rd
- 100 Rockingham Rd Unit 9
- 13 Tiger Tail Cir
- 90L Derryfield Rd
- 90L Derryfield Rd Unit L
- 18 Nottingham Rd
- 5 Sunnyside Ln Unit R
- 66 Derryfield Rd Unit L