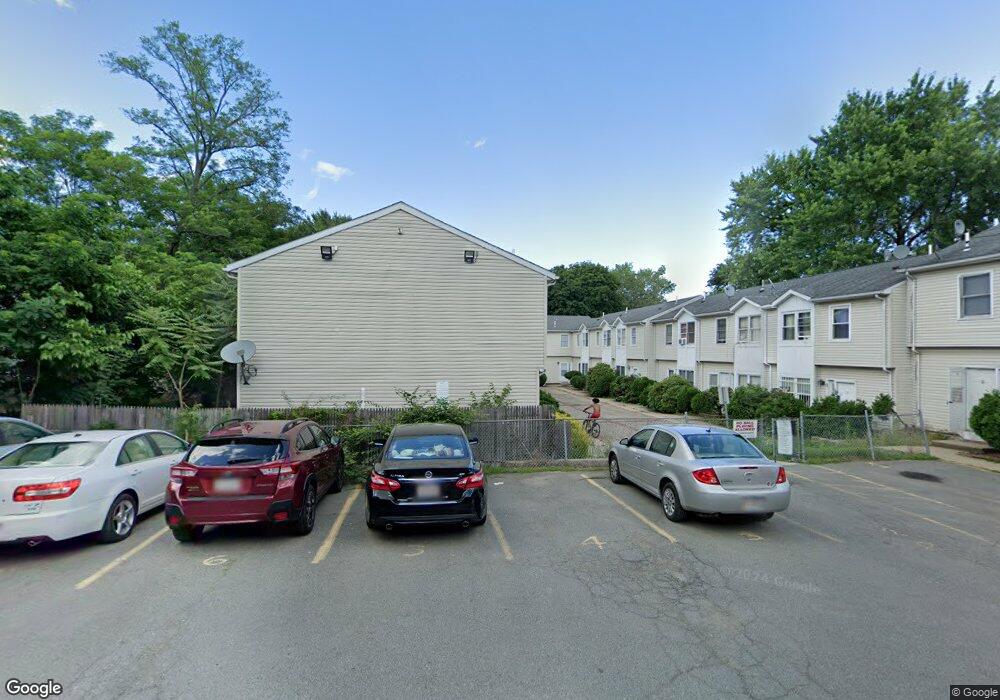
2 Howe Terrace Unit 16 Dorchester, MA 02125
Uphams Corner-Jones Hill NeighborhoodEstimated Value: $375,000 - $505,000
3
Beds
2
Baths
1,056
Sq Ft
$418/Sq Ft
Est. Value
About This Home
This home is located at 2 Howe Terrace Unit 16, Dorchester, MA 02125 and is currently estimated at $441,202, approximately $417 per square foot. 2 Howe Terrace Unit 16 is a home located in Suffolk County with nearby schools including Pope John Paul II Catholic Academy Columbia Campus and Cristo Rey Boston High School.
Ownership History
Date
Name
Owned For
Owner Type
Purchase Details
Closed on
Mar 16, 2006
Sold by
Lawrence Felicce and Webb James
Bought by
Ziegaye Girmay C and Woldesenbet Netsanet B
Current Estimated Value
Home Financials for this Owner
Home Financials are based on the most recent Mortgage that was taken out on this home.
Original Mortgage
$157,850
Outstanding Balance
$89,736
Interest Rate
6.27%
Mortgage Type
Purchase Money Mortgage
Estimated Equity
$351,466
Purchase Details
Closed on
Apr 30, 1997
Sold by
Fhlmc
Bought by
Lawrence Felice
Home Financials for this Owner
Home Financials are based on the most recent Mortgage that was taken out on this home.
Original Mortgage
$51,300
Interest Rate
7.85%
Mortgage Type
Purchase Money Mortgage
Purchase Details
Closed on
Nov 13, 1996
Sold by
Gooding Sandra E and Gooding Fhlmc
Bought by
Fhlmc
Create a Home Valuation Report for This Property
The Home Valuation Report is an in-depth analysis detailing your home's value as well as a comparison with similar homes in the area
Home Values in the Area
Average Home Value in this Area
Purchase History
| Date | Buyer | Sale Price | Title Company |
|---|---|---|---|
| Ziegaye Girmay C | $205,000 | -- | |
| Lawrence Felice | $54,000 | -- | |
| Fhlmc | $49,900 | -- |
Source: Public Records
Mortgage History
| Date | Status | Borrower | Loan Amount |
|---|---|---|---|
| Open | Ziegaye Girmay C | $157,850 | |
| Previous Owner | Fhlmc | $10,000 | |
| Previous Owner | Fhlmc | $164,000 | |
| Previous Owner | Fhlmc | $112,200 | |
| Previous Owner | Fhlmc | $51,300 |
Source: Public Records
Tax History Compared to Growth
Tax History
| Year | Tax Paid | Tax Assessment Tax Assessment Total Assessment is a certain percentage of the fair market value that is determined by local assessors to be the total taxable value of land and additions on the property. | Land | Improvement |
|---|---|---|---|---|
| 2025 | $3,599 | $310,800 | $0 | $310,800 |
| 2024 | $2,784 | $255,400 | $0 | $255,400 |
| 2023 | $2,661 | $247,800 | $0 | $247,800 |
| 2022 | $2,567 | $235,900 | $0 | $235,900 |
| 2021 | $2,444 | $229,100 | $0 | $229,100 |
| 2020 | $1,788 | $169,300 | $0 | $169,300 |
| 2019 | $1,668 | $158,300 | $0 | $158,300 |
| 2018 | $1,579 | $150,700 | $0 | $150,700 |
| 2017 | $1,534 | $144,900 | $0 | $144,900 |
| 2016 | $1,393 | $126,600 | $0 | $126,600 |
| 2015 | $1,429 | $118,000 | $0 | $118,000 |
| 2014 | $1,413 | $112,300 | $0 | $112,300 |
Source: Public Records
Map
Nearby Homes
- 20 Rill St
- 22 Ronan St
- 3 Ware St
- 106 Sawyer Ave Unit 3
- 22 High St Unit 203
- 22 High St Unit 201
- 22 High St Unit 103
- 22 High St Unit PH12
- 22 High St Unit PH13
- 22 High St Unit 104
- 22 High St Unit PH11
- 35-37 Clarkson St
- 52 Bellevue St Unit 1
- 52 Bellevue St Unit 3
- 52 Bellevue St Unit 2
- 33 Adams St Unit 3
- 33 Adams St Unit 1
- 5 Wheelock Ave
- 11 Savin Hill Ave
- 60 Stanley St Unit 301
- 2 Howe Terrace Unit 17
- 2 Howe Terrace Unit 15
- 2 Howe Terrace Unit 14
- 2 Howe Terrace Unit 13
- 2 Howe Terrace Unit 12
- 2 Howe Terrace Unit 10
- 2 Howe Terrace Unit 9
- 2 Howe Terrace Unit 8
- 2 Howe Terrace Unit 7
- 2 Howe Terrace Unit 6
- 2 Howe Terrace Unit 5
- 2 Howe Terrace Unit 4
- 2 Howe Terrace
- 2 Howe Terrace Unit 1
- 2 Howe Terrace Unit 2
- 2 Howe Terrace Unit 2A
- 2 Howe St Unit 2
- 7 Howe Terrace Unit 7
- 14 Howe Terrace Unit 1
- 22 Howe St Unit 24