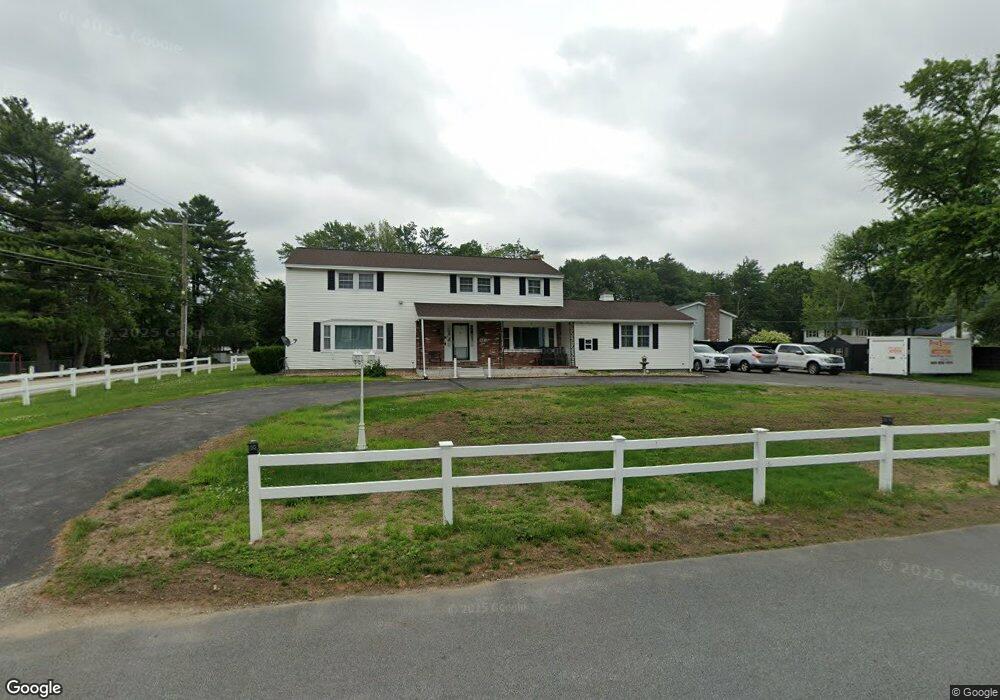
2 Hutton St Nashua, NH 03060
South End Nashua NeighborhoodEstimated Value: $623,000 - $681,000
5
Beds
3
Baths
3,048
Sq Ft
$215/Sq Ft
Est. Value
About This Home
This home is located at 2 Hutton St, Nashua, NH 03060 and is currently estimated at $655,082, approximately $214 per square foot. 2 Hutton St is a home located in Hillsborough County with nearby schools including Sunset Heights Elementary School, Elm Street Middle School, and Nashua High School North.
Ownership History
Date
Name
Owned For
Owner Type
Purchase Details
Closed on
Dec 20, 1999
Sold by
Kruegar Leslie P
Bought by
Donald J Deborah A Ake
Current Estimated Value
Home Financials for this Owner
Home Financials are based on the most recent Mortgage that was taken out on this home.
Original Mortgage
$212,415
Interest Rate
7.81%
Mortgage Type
Purchase Money Mortgage
Create a Home Valuation Report for This Property
The Home Valuation Report is an in-depth analysis detailing your home's value as well as a comparison with similar homes in the area
Home Values in the Area
Average Home Value in this Area
Purchase History
| Date | Buyer | Sale Price | Title Company |
|---|---|---|---|
| Donald J Deborah A Ake | $210,000 | -- |
Source: Public Records
Mortgage History
| Date | Status | Borrower | Loan Amount |
|---|---|---|---|
| Open | Donald J Deborah A Ake | $332,000 | |
| Closed | Donald J Deborah A Ake | $212,415 |
Source: Public Records
Tax History
| Year | Tax Paid | Tax Assessment Tax Assessment Total Assessment is a certain percentage of the fair market value that is determined by local assessors to be the total taxable value of land and additions on the property. | Land | Improvement |
|---|---|---|---|---|
| 2024 | $8,518 | $535,700 | $163,700 | $372,000 |
| 2023 | $8,018 | $439,800 | $131,000 | $308,800 |
| 2022 | $7,947 | $439,800 | $131,000 | $308,800 |
| 2021 | $8,016 | $345,200 | $91,700 | $253,500 |
| 2020 | $7,748 | $342,700 | $91,700 | $251,000 |
| 2019 | $7,457 | $342,700 | $91,700 | $251,000 |
| 2018 | $7,269 | $342,700 | $91,700 | $251,000 |
| 2017 | $8,588 | $333,000 | $78,400 | $254,600 |
| 2016 | $8,348 | $333,000 | $78,400 | $254,600 |
| 2015 | $8,168 | $333,000 | $78,400 | $254,600 |
| 2014 | $8,009 | $333,000 | $78,400 | $254,600 |
Source: Public Records
Map
Nearby Homes
- 17 Herrick St
- 21 Victor Ave
- 6 Hayden St
- 28 Stevens St Unit 162
- 97 Linwood St
- 4 Brookside Terrace
- 49 Lovell St
- 24 Shadwell Rd
- 15 Lovell St Unit 10
- 1 E Hobart St
- 2 Wakefield Dr
- 54 Linton St
- 25 Kern Dr Unit 25
- 22 Kern Dr
- 130 Westwood Dr
- 22 Wilder St
- 25 Robinhood Rd
- 24 E Otterson St
- 4 Henry David Dr Unit 203
- 4 Henry David Dr Unit 202