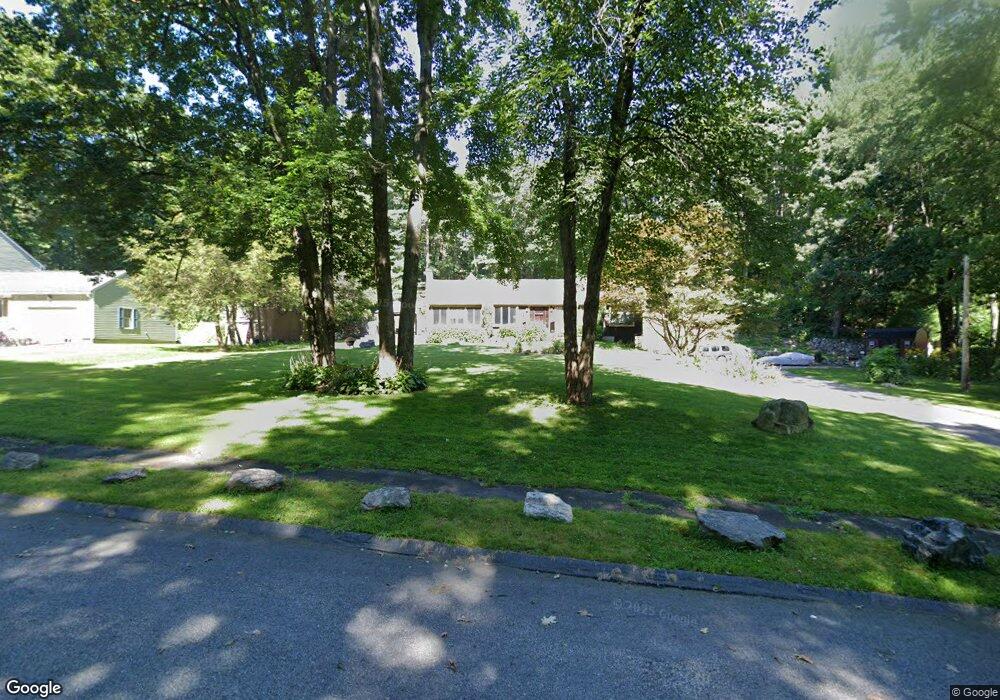
2 Increase Ward Dr Northborough, MA 01532
Estimated Value: $910,491 - $1,055,000
3
Beds
4
Baths
2,817
Sq Ft
$344/Sq Ft
Est. Value
About This Home
This home is located at 2 Increase Ward Dr, Northborough, MA 01532 and is currently estimated at $969,373, approximately $344 per square foot. 2 Increase Ward Dr is a home located in Worcester County with nearby schools including Lincoln Street Elementary School, Robert E. Melican Middle School, and Algonquin Regional High School.
Ownership History
Date
Name
Owned For
Owner Type
Purchase Details
Closed on
Mar 27, 1998
Sold by
Benedetti John M and Benedetti Susan M
Bought by
Ferguson Jay C and Houston Diane J
Current Estimated Value
Purchase Details
Closed on
Jun 2, 1994
Sold by
State Street B&T
Bought by
Benedetti John
Create a Home Valuation Report for This Property
The Home Valuation Report is an in-depth analysis detailing your home's value as well as a comparison with similar homes in the area
Home Values in the Area
Average Home Value in this Area
Purchase History
| Date | Buyer | Sale Price | Title Company |
|---|---|---|---|
| Ferguson Jay C | $265,000 | -- | |
| Benedetti John | $50,000 | -- |
Source: Public Records
Mortgage History
| Date | Status | Borrower | Loan Amount |
|---|---|---|---|
| Open | Benedetti John | $360,000 | |
| Closed | Benedetti John | $100,000 | |
| Closed | Benedetti John | $307,500 |
Source: Public Records
Tax History
| Year | Tax Paid | Tax Assessment Tax Assessment Total Assessment is a certain percentage of the fair market value that is determined by local assessors to be the total taxable value of land and additions on the property. | Land | Improvement |
|---|---|---|---|---|
| 2025 | $12,051 | $845,700 | $279,400 | $566,300 |
| 2024 | $11,128 | $779,300 | $231,100 | $548,200 |
| 2023 | $10,948 | $740,200 | $218,300 | $521,900 |
| 2022 | $10,310 | $625,200 | $207,900 | $417,300 |
| 2021 | $9,959 | $581,700 | $189,100 | $392,600 |
| 2020 | $10,224 | $592,700 | $189,100 | $403,600 |
| 2019 | $9,789 | $570,800 | $183,500 | $387,300 |
| 2018 | $9,241 | $531,400 | $173,100 | $358,300 |
| 2017 | $8,608 | $495,000 | $173,100 | $321,900 |
| 2016 | $8,180 | $476,400 | $169,700 | $306,700 |
| 2015 | $7,773 | $464,600 | $172,500 | $292,100 |
| 2014 | $7,361 | $443,700 | $172,500 | $271,200 |
Source: Public Records
Map
Nearby Homes
- 105 Lincoln St
- 6 Lydias Way Unit 6
- 217 W Main St
- 13 Dennis Cir
- 81 West St
- 39 Pleasant St Unit A6
- 39 Pleasant St Unit C5
- 39 Pleasant St Unit A17
- 39 Pleasant St Unit B19
- 39 Pleasant St Unit B10
- 39 Pleasant St Unit B4
- 5 Swan View Common Dr
- 5 Country Candle Ln Unit 5
- 18 Joseph Rd
- 19 Intervale Farm Ln
- 106 School St
- 85 Hudson St Unit 85
- 9 Morningside Dr
- 7-11 Reservoir St
- 1A Mentzer Ave
Your Personal Tour Guide
Ask me questions while you tour the home.