Estimated Value: $1,337,500 - $1,647,000
3
Beds
3
Baths
3,033
Sq Ft
$484/Sq Ft
Est. Value
About This Home
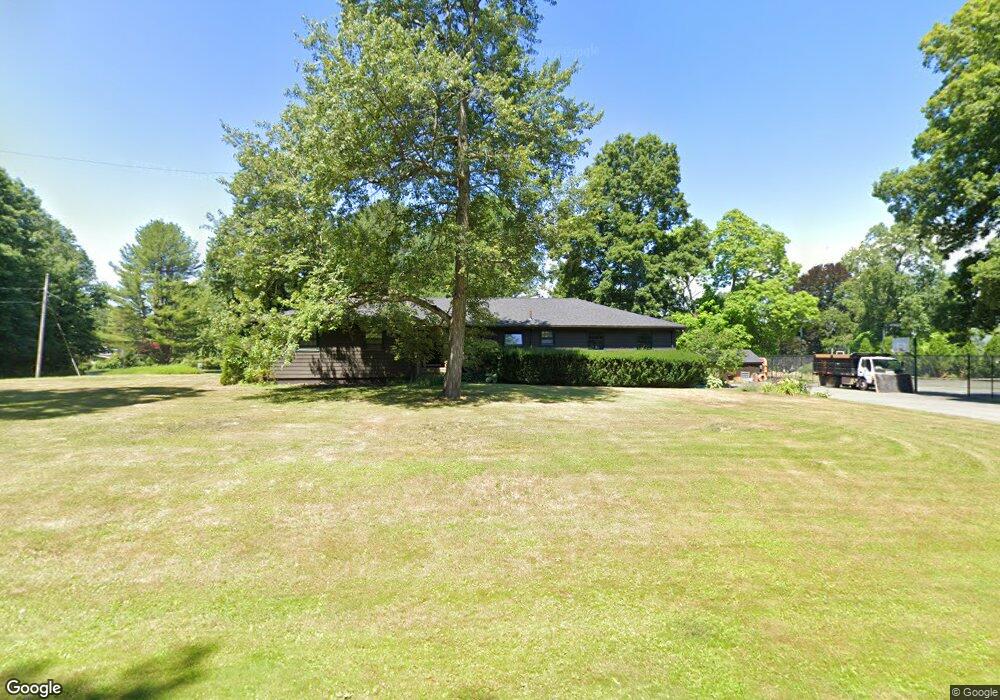
This home is located at 2 Indian Spring Rd, Dover, MA 02030 and is currently estimated at $1,467,625, approximately $483 per square foot. 2 Indian Spring Rd is a home located in Norfolk County with nearby schools including Chickering Elementary School, Dover-Sherborn Regional Middle School, and Dover-Sherborn Regional High School.
Ownership History
Date
Name
Owned For
Owner Type
Purchase Details
Closed on
Jun 5, 2024
Sold by
Ethan Fa Ferrari T and Ethan Ferrari
Bought by
Ferrari Lt and Ferrari
Current Estimated Value
Purchase Details
Closed on
Sep 4, 2013
Sold by
Ferrari Ethan F and Ferrari Laura A
Bought by
Ethan F A Ferrari T and Ferrari Ethan F
Purchase Details
Closed on
Mar 29, 1999
Sold by
Ferrari Carole
Bought by
Ferrari Ethan Fa and Ferrari Laura A
Purchase Details
Closed on
Feb 24, 1997
Sold by
Tallarida Primo J
Bought by
Ferrari Carole
Purchase Details
Closed on
Jun 28, 1993
Sold by
Barnett Richard E and Barnett Laura P
Bought by
Arnheim E Dianne
Purchase Details
Closed on
Sep 1, 1989
Sold by
Moog Robert A
Bought by
Barnett Richard E
Create a Home Valuation Report for This Property
The Home Valuation Report is an in-depth analysis detailing your home's value as well as a comparison with similar homes in the area
Home Values in the Area
Average Home Value in this Area
Purchase History
| Date | Buyer | Sale Price | Title Company |
|---|---|---|---|
| Ferrari Lt | -- | None Available | |
| Ferrari Lt | -- | None Available | |
| Ethan F A Ferrari T | -- | -- | |
| Ferrari Carole | $340,000 | -- | |
| Arnheim E Dianne | $247,000 | -- | |
| Barnett Richard E | $260,000 | -- | |
| Ethan F A Ferrari T F | -- | -- | |
| Ferrari Ethan Fa | $390,000 | -- | |
| Ferrari Carole | $340,000 | -- | |
| Arnheim E Dianne | $247,000 | -- | |
| Barnett Richard E | $260,000 | -- |
Source: Public Records
Mortgage History
| Date | Status | Borrower | Loan Amount |
|---|---|---|---|
| Previous Owner | Barnett Richard E | $145,000 | |
| Previous Owner | Barnett Richard E | $417,000 |
Source: Public Records
Tax History
| Year | Tax Paid | Tax Assessment Tax Assessment Total Assessment is a certain percentage of the fair market value that is determined by local assessors to be the total taxable value of land and additions on the property. | Land | Improvement |
|---|---|---|---|---|
| 2025 | $12,261 | $1,087,900 | $750,700 | $337,200 |
| 2024 | $11,677 | $1,065,400 | $750,700 | $314,700 |
| 2023 | $11,579 | $949,900 | $655,200 | $294,700 |
| 2022 | $10,648 | $857,300 | $600,800 | $256,500 |
| 2021 | $10,877 | $843,800 | $600,800 | $243,000 |
| 2020 | $10,834 | $843,800 | $600,800 | $243,000 |
| 2019 | $10,910 | $843,800 | $600,800 | $243,000 |
| 2018 | $10,018 | $780,200 | $546,300 | $233,900 |
| 2017 | $10,477 | $802,800 | $546,300 | $256,500 |
| 2016 | $9,874 | $766,600 | $519,100 | $247,500 |
| 2015 | $9,646 | $759,500 | $519,100 | $240,400 |
Source: Public Records
Map
Nearby Homes
Your Personal Tour Guide
Ask me questions while you tour the home.