2 Irish Setter Ln Gilford, NH 03249
Estimated Value: $893,000 - $1,091,000
5
Beds
4
Baths
4,657
Sq Ft
$215/Sq Ft
Est. Value
About This Home
This home is located at 2 Irish Setter Ln, Gilford, NH 03249 and is currently estimated at $999,603, approximately $214 per square foot. 2 Irish Setter Ln is a home located in Belknap County with nearby schools including Gilford Elementary School, Gilford Middle School, and Gilford High School.
Ownership History
Date
Name
Owned For
Owner Type
Purchase Details
Closed on
Dec 9, 1998
Sold by
Nutter William K
Bought by
Remick Randall J and Remick Kristen A
Current Estimated Value
Home Financials for this Owner
Home Financials are based on the most recent Mortgage that was taken out on this home.
Original Mortgage
$130,400
Outstanding Balance
$29,671
Interest Rate
6.8%
Estimated Equity
$969,932
Create a Home Valuation Report for This Property
The Home Valuation Report is an in-depth analysis detailing your home's value as well as a comparison with similar homes in the area
Home Values in the Area
Average Home Value in this Area
Purchase History
| Date | Buyer | Sale Price | Title Company |
|---|---|---|---|
| Remick Randall J | $161,500 | -- |
Source: Public Records
Mortgage History
| Date | Status | Borrower | Loan Amount |
|---|---|---|---|
| Open | Remick Randall J | $130,400 |
Source: Public Records
Tax History Compared to Growth
Tax History
| Year | Tax Paid | Tax Assessment Tax Assessment Total Assessment is a certain percentage of the fair market value that is determined by local assessors to be the total taxable value of land and additions on the property. | Land | Improvement |
|---|---|---|---|---|
| 2024 | $10,329 | $918,110 | $155,810 | $762,300 |
| 2023 | $9,457 | $918,110 | $155,810 | $762,300 |
| 2022 | $8,693 | $709,660 | $96,660 | $613,000 |
| 2021 | $8,715 | $709,660 | $96,660 | $613,000 |
| 2020 | $9,246 | $615,190 | $95,190 | $520,000 |
| 2019 | $9,074 | $572,110 | $89,210 | $482,900 |
| 2018 | $8,128 | $477,000 | $73,000 | $404,000 |
| 2017 | $8,233 | $477,000 | $73,000 | $404,000 |
| 2016 | $8,393 | $467,580 | $73,380 | $394,200 |
| 2015 | $8,284 | $460,990 | $76,190 | $384,800 |
| 2011 | $7,525 | $405,660 | $98,960 | $306,700 |
Source: Public Records
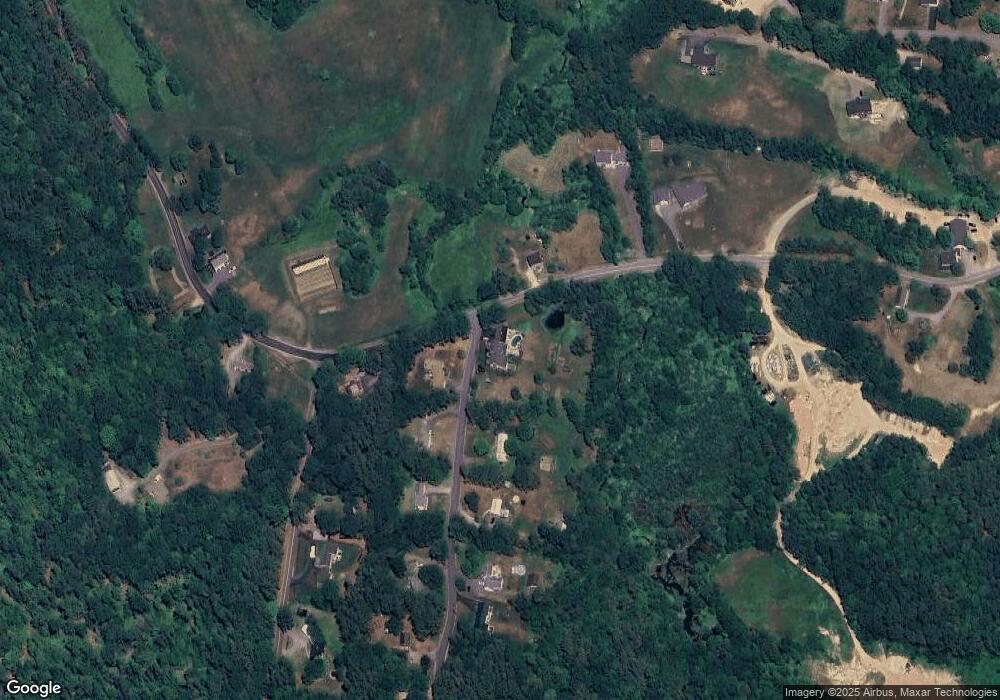
Map
Nearby Homes
- 21 Wild Acres Rd
- 771 Gilford Ave
- 30 Belknap Mountain Rd
- 19 Knollwood Dr
- 700 Belknap Mountain Rd
- 119 Cherry Valley Rd
- 128 Cotton Hill Rd
- 6 Colonial Dr
- 165 Country Club Rd
- 84 Young Rd
- 7 Countryside Dr
- 32 David Lewis Rd
- 0 Sanborn St
- 284 Pine St
- 162 Gilford Ave
- 84 Old Lake Shore Rd
- 74 Morrill St
- 102 Curtis Rd
- 56 Fairview St
- Lot 1 Winter St
- 1 Irish Setter Ln
- 264 Hoyt Rd
- 14 Irish Setter Ln
- 13 Irish Setter Ln
- 247 Hoyt Rd
- 21 Irish Setter Ln
- 22 Irish Setter Ln
- 284 Hoyt Rd
- 161 Wild Acres Rd
- 30 Irish Setter Ln
- 235 Hoyt Rd
- 290 Hoyt Rd
- 29 Irish Setter Ln
- 36 Irish Setter Ln
- 151 Wild Acres Rd
- 236 Hoyt Rd
- 35 Irish Setter Ln
- 7 Destination Dr
- 141 Wild Acres Rd
- 166 Wild Acres Rd