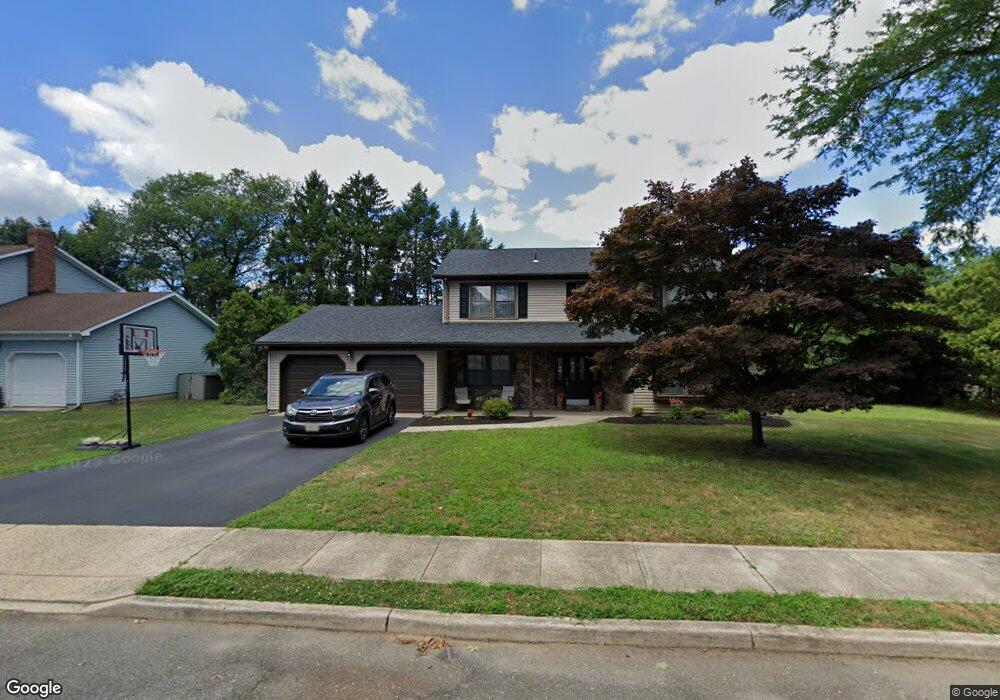
2 Ivins Ct Matawan, NJ 07747
Estimated Value: $670,000 - $871,000
4
Beds
3
Baths
2,417
Sq Ft
$315/Sq Ft
Est. Value
About This Home
This home is located at 2 Ivins Ct, Matawan, NJ 07747 and is currently estimated at $762,460, approximately $315 per square foot. 2 Ivins Ct is a home located in Monmouth County with nearby schools including Matawan Reg High School, St Benedict School, and St. Joseph Elementary School.
Ownership History
Date
Name
Owned For
Owner Type
Purchase Details
Closed on
Oct 7, 2012
Sold by
Earl David W
Bought by
Earl David W and Earl Vivian
Current Estimated Value
Purchase Details
Closed on
Aug 28, 2008
Sold by
Estate Of Robin Eddy and Martelliti Stacy E
Bought by
Earl David W
Home Financials for this Owner
Home Financials are based on the most recent Mortgage that was taken out on this home.
Original Mortgage
$322,000
Outstanding Balance
$215,909
Interest Rate
6.69%
Mortgage Type
Purchase Money Mortgage
Estimated Equity
$546,551
Create a Home Valuation Report for This Property
The Home Valuation Report is an in-depth analysis detailing your home's value as well as a comparison with similar homes in the area
Home Values in the Area
Average Home Value in this Area
Purchase History
| Date | Buyer | Sale Price | Title Company |
|---|---|---|---|
| Earl David W | -- | None Available | |
| Earl David W | $352,000 | None Available |
Source: Public Records
Mortgage History
| Date | Status | Borrower | Loan Amount |
|---|---|---|---|
| Open | Earl David W | $322,000 |
Source: Public Records
Tax History
| Year | Tax Paid | Tax Assessment Tax Assessment Total Assessment is a certain percentage of the fair market value that is determined by local assessors to be the total taxable value of land and additions on the property. | Land | Improvement |
|---|---|---|---|---|
| 2025 | $10,449 | $563,600 | $302,000 | $261,600 |
| 2024 | $10,353 | $517,000 | $260,200 | $256,800 |
Source: Public Records
Map
Nearby Homes
- 5 Limerick Place
- 20 Galway Dr
- 17 Idlebrook Ln
- 16 Galway Dr
- 99 Idlebrook Ln
- 72 Idlebrook Ln
- 114 Dundee Ct
- 3 Tolas Dr
- 3 Noble Place
- 13 Cresci Blvd
- 537 S Atlantic Ave
- 323 Arlene Terrace
- 5 7th St
- 9 Amherst Ct
- 315 Wellington Place
- 611 Wellington Place
- 283 Gloucester Ct
- 244 Lloyd Rd
- 293 Gloucester Ct
- 292 Gloucester Ct
Your Personal Tour Guide
Ask me questions while you tour the home.