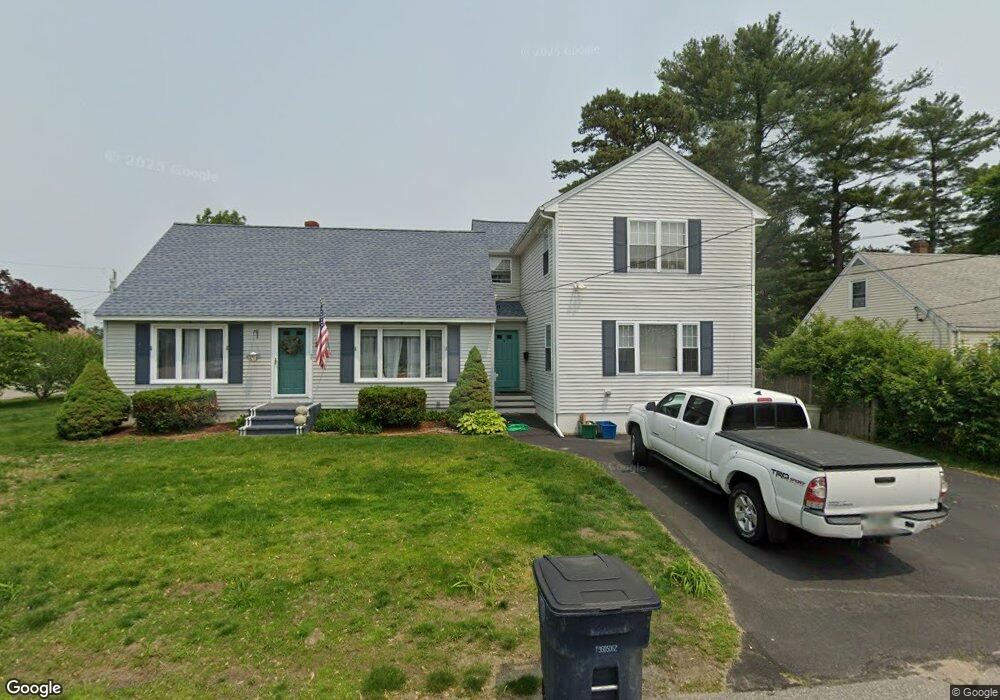
2 James St Nashua, NH 03060
South End Nashua NeighborhoodEstimated Value: $549,000 - $685,000
5
Beds
3
Baths
2,527
Sq Ft
$242/Sq Ft
Est. Value
About This Home
This home is located at 2 James St, Nashua, NH 03060 and is currently estimated at $610,355, approximately $241 per square foot. 2 James St is a home located in Hillsborough County with nearby schools including Fairgrounds Elementary School, Fairgrounds Middle School, and Nashua High School South.
Ownership History
Date
Name
Owned For
Owner Type
Purchase Details
Closed on
Oct 26, 2016
Sold by
Duvarney Michelle
Bought by
Girouard Kevin M
Current Estimated Value
Home Financials for this Owner
Home Financials are based on the most recent Mortgage that was taken out on this home.
Original Mortgage
$301,150
Outstanding Balance
$241,734
Interest Rate
3.5%
Mortgage Type
New Conventional
Estimated Equity
$368,621
Purchase Details
Closed on
Jul 30, 1998
Sold by
Theroux Cecile
Bought by
Duvarney Michelle N
Home Financials for this Owner
Home Financials are based on the most recent Mortgage that was taken out on this home.
Original Mortgage
$77,000
Interest Rate
6.92%
Mortgage Type
Purchase Money Mortgage
Create a Home Valuation Report for This Property
The Home Valuation Report is an in-depth analysis detailing your home's value as well as a comparison with similar homes in the area
Home Values in the Area
Average Home Value in this Area
Purchase History
| Date | Buyer | Sale Price | Title Company |
|---|---|---|---|
| Girouard Kevin M | $317,000 | -- | |
| Duvarney Michelle N | $100,000 | -- |
Source: Public Records
Mortgage History
| Date | Status | Borrower | Loan Amount |
|---|---|---|---|
| Open | Girouard Kevin M | $301,150 | |
| Previous Owner | Duvarney Michelle N | $25,000 | |
| Previous Owner | Duvarney Michelle N | $100,000 | |
| Previous Owner | Duvarney Michelle N | $50,000 | |
| Previous Owner | Duvarney Michelle N | $77,000 |
Source: Public Records
Tax History Compared to Growth
Tax History
| Year | Tax Paid | Tax Assessment Tax Assessment Total Assessment is a certain percentage of the fair market value that is determined by local assessors to be the total taxable value of land and additions on the property. | Land | Improvement |
|---|---|---|---|---|
| 2024 | $7,972 | $501,400 | $150,100 | $351,300 |
| 2023 | $7,505 | $411,700 | $120,100 | $291,600 |
| 2022 | $7,439 | $411,700 | $120,100 | $291,600 |
| 2021 | $7,036 | $303,000 | $80,100 | $222,900 |
| 2020 | $6,880 | $304,300 | $80,100 | $224,200 |
| 2019 | $6,622 | $304,300 | $80,100 | $224,200 |
| 2018 | $6,454 | $304,300 | $80,100 | $224,200 |
| 2017 | $6,321 | $245,100 | $69,300 | $175,800 |
| 2016 | $6,034 | $240,700 | $69,300 | $171,400 |
| 2015 | $5,904 | $240,700 | $69,300 | $171,400 |
| 2014 | $5,789 | $240,700 | $69,300 | $171,400 |
Source: Public Records
Map
Nearby Homes
- 17 Herrick St
- 2 Wakefield Dr
- 15 Learned St Unit 123
- 6 Hayden St
- 23 Glen Dr
- 63 Dexter St
- 9 Byron Dr
- 97 Linwood St
- 36 Eastman St Unit 26
- 61 Spindlewick Dr
- 5 Appaloosa Place
- 29 Dickens St
- 4 Henry David Dr Unit 203
- 22 Kern Dr
- 30 Gingras Dr
- 11 Bordeaux St
- 125 Lille Rd
- 15 Lovell St Unit 3
- 15 Lovell St Unit 7
- 15 Lovell St Unit 10