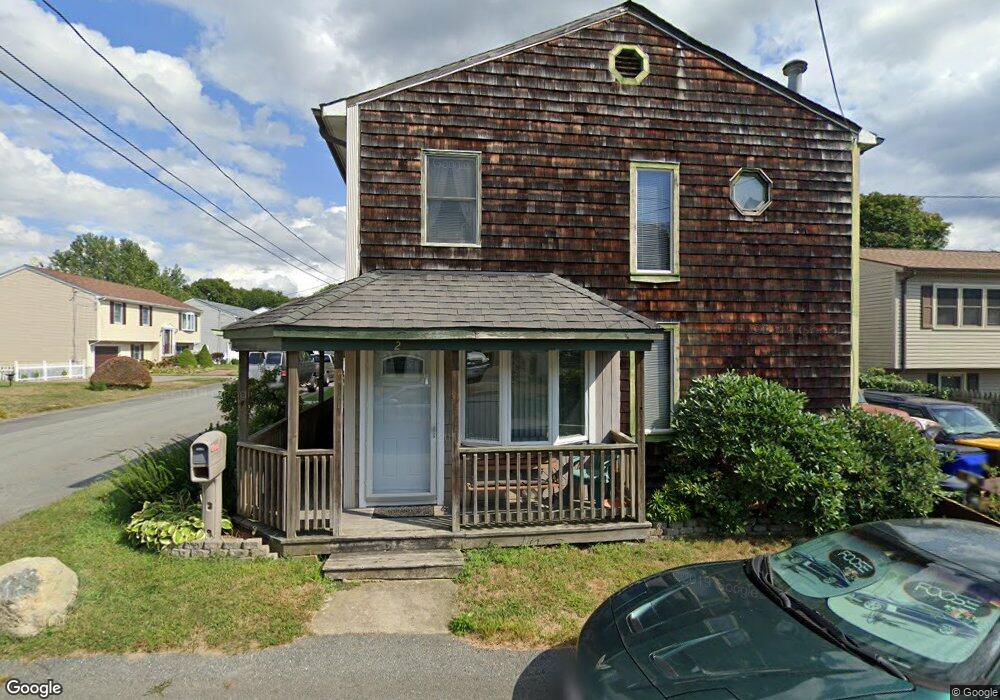
2 Kempton St Fall River, MA 02724
Sandy Beach NeighborhoodEstimated Value: $446,000 - $636,000
4
Beds
3
Baths
2,429
Sq Ft
$208/Sq Ft
Est. Value
About This Home
This home is located at 2 Kempton St, Fall River, MA 02724 and is currently estimated at $504,759, approximately $207 per square foot. 2 Kempton St is a home located in Bristol County with nearby schools including Carlton M. Viveiros Elementary School, Matthew J. Kuss Middle School, and B M C Durfee High School.
Ownership History
Date
Name
Owned For
Owner Type
Purchase Details
Closed on
Mar 12, 2018
Sold by
Mello Raymond A and Mello Sandra J
Bought by
Melo Raymond A and Mello Sandra J
Current Estimated Value
Home Financials for this Owner
Home Financials are based on the most recent Mortgage that was taken out on this home.
Original Mortgage
$201,465
Outstanding Balance
$175,703
Interest Rate
5.25%
Mortgage Type
FHA
Estimated Equity
$329,056
Purchase Details
Closed on
Nov 25, 1988
Sold by
Ramos Donald A
Bought by
Mell Raymond A
Purchase Details
Closed on
Apr 19, 1988
Sold by
Cabral Antonio
Bought by
Ramos Donald A
Purchase Details
Closed on
Dec 17, 1987
Sold by
Demoura Peggy Ann
Bought by
Cabral Antonio
Create a Home Valuation Report for This Property
The Home Valuation Report is an in-depth analysis detailing your home's value as well as a comparison with similar homes in the area
Home Values in the Area
Average Home Value in this Area
Purchase History
| Date | Buyer | Sale Price | Title Company |
|---|---|---|---|
| Melo Raymond A | -- | -- | |
| Melo Raymond A | -- | -- | |
| Mell Raymond A | $135,000 | -- | |
| Ramos Donald A | $55,000 | -- | |
| Cabral Antonio | $1,000 | -- |
Source: Public Records
Mortgage History
| Date | Status | Borrower | Loan Amount |
|---|---|---|---|
| Open | Melo Raymond A | $201,465 | |
| Closed | Melo Raymond A | $201,465 | |
| Previous Owner | Cabral Antonio | $221,400 | |
| Previous Owner | Cabral Antonio | $211,000 |
Source: Public Records
Tax History
| Year | Tax Paid | Tax Assessment Tax Assessment Total Assessment is a certain percentage of the fair market value that is determined by local assessors to be the total taxable value of land and additions on the property. | Land | Improvement |
|---|---|---|---|---|
| 2025 | $4,171 | $364,300 | $115,300 | $249,000 |
| 2024 | $3,915 | $340,700 | $113,100 | $227,600 |
| 2023 | $3,995 | $325,600 | $101,900 | $223,700 |
| 2022 | $3,555 | $281,700 | $96,100 | $185,600 |
| 2021 | $4,507 | $243,600 | $91,800 | $151,800 |
| 2020 | $3,318 | $229,600 | $87,600 | $142,000 |
| 2019 | $3,308 | $226,900 | $91,600 | $135,300 |
| 2018 | $3,206 | $219,300 | $92,300 | $127,000 |
| 2017 | $3,038 | $217,000 | $92,300 | $124,700 |
| 2016 | $2,892 | $212,200 | $95,100 | $117,100 |
| 2015 | $2,711 | $207,300 | $95,100 | $112,200 |
| 2014 | $2,608 | $207,300 | $95,100 | $112,200 |
Source: Public Records
Map
Nearby Homes
Your Personal Tour Guide
Ask me questions while you tour the home.