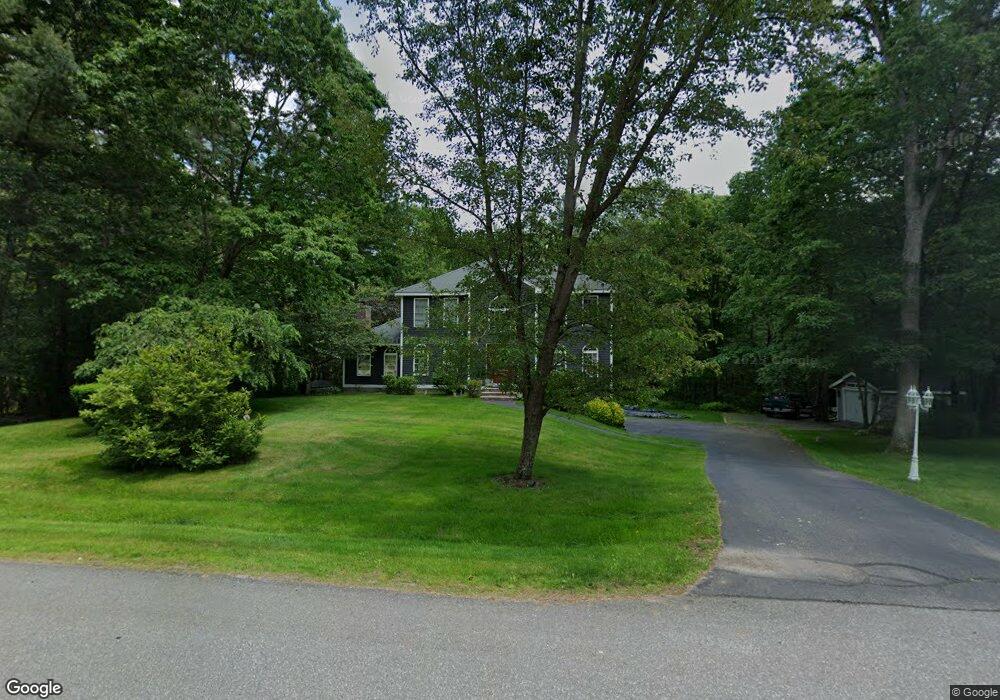
2 Lantern Ln Londonderry, NH 03053
Estimated Value: $703,000 - $773,000
3
Beds
3
Baths
2,502
Sq Ft
$296/Sq Ft
Est. Value
About This Home
This home is located at 2 Lantern Ln, Londonderry, NH 03053 and is currently estimated at $740,573, approximately $295 per square foot. 2 Lantern Ln is a home with nearby schools including Londonderry Middle School, Londonderry Senior High School, and Southern New Hampshire Montessori Academy.
Ownership History
Date
Name
Owned For
Owner Type
Purchase Details
Closed on
Aug 26, 1997
Sold by
Stonemark Homes Inc
Bought by
Charbonneau Marc J and Charbonneau Laurie
Current Estimated Value
Home Financials for this Owner
Home Financials are based on the most recent Mortgage that was taken out on this home.
Original Mortgage
$115,900
Outstanding Balance
$17,882
Interest Rate
7.42%
Estimated Equity
$722,691
Create a Home Valuation Report for This Property
The Home Valuation Report is an in-depth analysis detailing your home's value as well as a comparison with similar homes in the area
Home Values in the Area
Average Home Value in this Area
Purchase History
| Date | Buyer | Sale Price | Title Company |
|---|---|---|---|
| Charbonneau Marc J | $190,000 | -- |
Source: Public Records
Mortgage History
| Date | Status | Borrower | Loan Amount |
|---|---|---|---|
| Open | Charbonneau Marc J | $115,900 |
Source: Public Records
Tax History Compared to Growth
Tax History
| Year | Tax Paid | Tax Assessment Tax Assessment Total Assessment is a certain percentage of the fair market value that is determined by local assessors to be the total taxable value of land and additions on the property. | Land | Improvement |
|---|---|---|---|---|
| 2024 | $9,962 | $617,200 | $223,800 | $393,400 |
| 2023 | $9,659 | $617,200 | $223,800 | $393,400 |
| 2022 | $9,222 | $499,000 | $167,900 | $331,100 |
| 2021 | $9,122 | $496,300 | $167,900 | $328,400 |
| 2020 | $8,850 | $440,100 | $137,200 | $302,900 |
| 2019 | $8,534 | $440,100 | $137,200 | $302,900 |
| 2018 | $8,238 | $377,900 | $114,100 | $263,800 |
| 2017 | $8,212 | $380,000 | $114,100 | $265,900 |
| 2016 | $8,170 | $380,000 | $114,100 | $265,900 |
| 2015 | $7,988 | $380,000 | $114,100 | $265,900 |
| 2014 | $8,014 | $380,000 | $114,100 | $265,900 |
| 2011 | -- | $383,700 | $114,100 | $269,600 |
Source: Public Records
Map
Nearby Homes