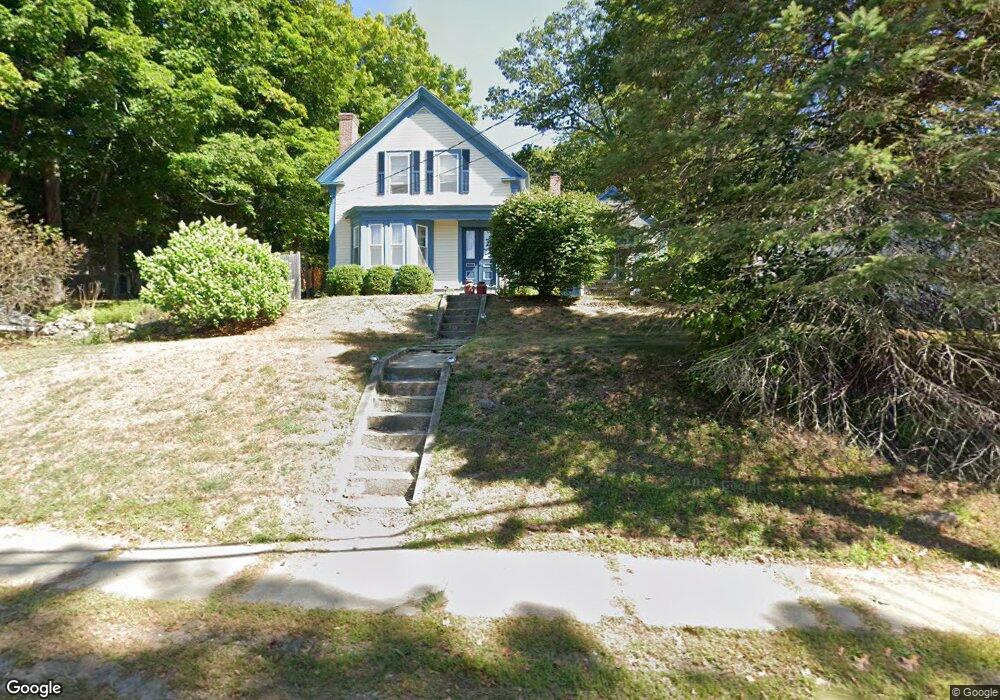
2 Main St Ashburnham, MA 01430
Estimated Value: $313,000 - $431,000
3
Beds
2
Baths
1,455
Sq Ft
$250/Sq Ft
Est. Value
About This Home
This home is located at 2 Main St, Ashburnham, MA 01430 and is currently estimated at $363,458, approximately $249 per square foot. 2 Main St is a home located in Worcester County with nearby schools including Oakmont Regional High School and Cushing Academy.
Ownership History
Date
Name
Owned For
Owner Type
Purchase Details
Closed on
Jul 27, 2001
Sold by
Martin Kevin P and Martin Barbara G
Bought by
Mitchell John T and Mitchell Tracie A
Current Estimated Value
Home Financials for this Owner
Home Financials are based on the most recent Mortgage that was taken out on this home.
Original Mortgage
$124,800
Interest Rate
7.18%
Mortgage Type
Purchase Money Mortgage
Purchase Details
Closed on
Jan 22, 1993
Sold by
Wernicki Gerard W and Young Joan M
Bought by
Martin Kevin P and Martin Barbara S
Create a Home Valuation Report for This Property
The Home Valuation Report is an in-depth analysis detailing your home's value as well as a comparison with similar homes in the area
Home Values in the Area
Average Home Value in this Area
Purchase History
| Date | Buyer | Sale Price | Title Company |
|---|---|---|---|
| Mitchell John T | $156,000 | -- | |
| Mitchell John T | $156,000 | -- | |
| Martin Kevin P | $75,000 | -- | |
| Martin Kevin P | $75,000 | -- |
Source: Public Records
Mortgage History
| Date | Status | Borrower | Loan Amount |
|---|---|---|---|
| Open | Martin Kevin P | $130,000 | |
| Closed | Martin Kevin P | $31,000 | |
| Closed | Martin Kevin P | $124,800 |
Source: Public Records
Tax History
| Year | Tax Paid | Tax Assessment Tax Assessment Total Assessment is a certain percentage of the fair market value that is determined by local assessors to be the total taxable value of land and additions on the property. | Land | Improvement |
|---|---|---|---|---|
| 2025 | $4,146 | $278,800 | $38,700 | $240,100 |
| 2024 | $4,073 | $258,600 | $38,700 | $219,900 |
| 2023 | $4,167 | $251,800 | $38,700 | $213,100 |
| 2022 | $4,208 | $222,900 | $37,300 | $185,600 |
| 2021 | $4,186 | $203,700 | $37,300 | $166,400 |
| 2020 | $4,248 | $203,700 | $37,300 | $166,400 |
| 2019 | $4,489 | $163,100 | $37,300 | $125,800 |
| 2018 | $3,599 | $153,800 | $35,600 | $118,200 |
| 2017 | $3,556 | $154,800 | $37,600 | $117,200 |
| 2016 | $3,460 | $152,100 | $36,700 | $115,400 |
| 2015 | $3,373 | $151,400 | $36,700 | $114,700 |
Source: Public Records
Map
Nearby Homes
Your Personal Tour Guide
Ask me questions while you tour the home.