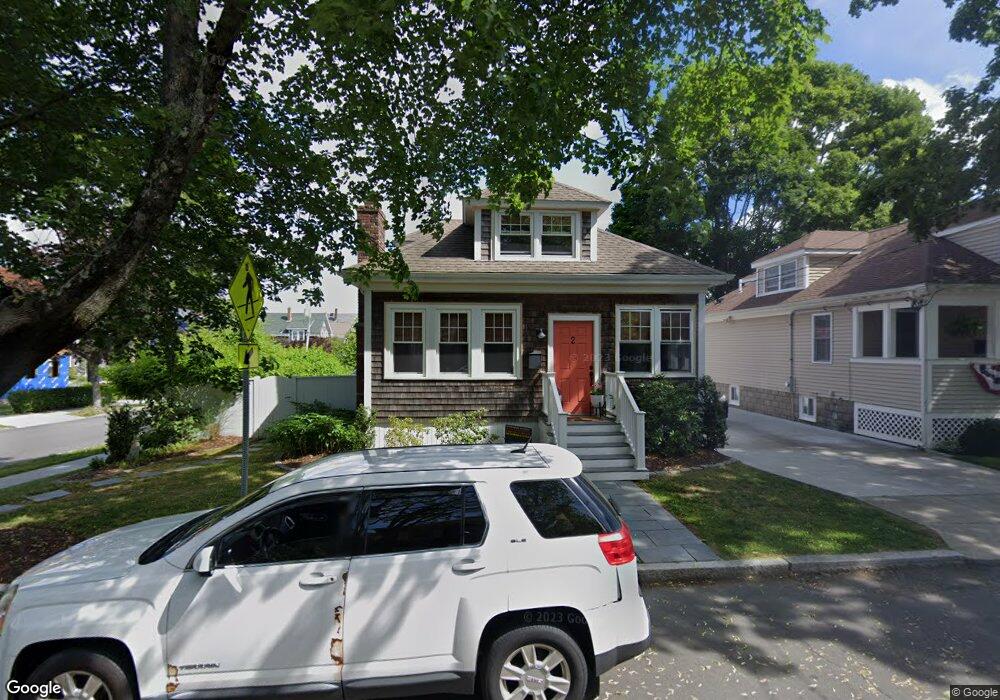
2 Maple Ave Fairhaven, MA 02719
Estimated Value: $504,949 - $677,000
3
Beds
2
Baths
1,594
Sq Ft
$361/Sq Ft
Est. Value
About This Home
This home is located at 2 Maple Ave, Fairhaven, MA 02719 and is currently estimated at $575,237, approximately $360 per square foot. 2 Maple Ave is a home located in Bristol County with nearby schools including Fairhaven High School, City On A Hill Charter Public School New Bedford, and St. Joseph School.
Ownership History
Date
Name
Owned For
Owner Type
Purchase Details
Closed on
Jul 29, 1998
Sold by
Reuss James L
Bought by
Lefleur Sharon E
Current Estimated Value
Home Financials for this Owner
Home Financials are based on the most recent Mortgage that was taken out on this home.
Original Mortgage
$118,610
Interest Rate
6.92%
Mortgage Type
Purchase Money Mortgage
Purchase Details
Closed on
Jan 15, 1988
Sold by
Dumas Henry R
Bought by
Reuss James L
Create a Home Valuation Report for This Property
The Home Valuation Report is an in-depth analysis detailing your home's value as well as a comparison with similar homes in the area
Home Values in the Area
Average Home Value in this Area
Purchase History
| Date | Buyer | Sale Price | Title Company |
|---|---|---|---|
| Lefleur Sharon E | $119,000 | -- | |
| Reuss James L | $116,160 | -- |
Source: Public Records
Mortgage History
| Date | Status | Borrower | Loan Amount |
|---|---|---|---|
| Open | Reuss James L | $175,000 | |
| Closed | Reuss James L | $145,000 | |
| Closed | Reuss James L | $20,000 | |
| Closed | Reuss James L | $118,610 |
Source: Public Records
Tax History
| Year | Tax Paid | Tax Assessment Tax Assessment Total Assessment is a certain percentage of the fair market value that is determined by local assessors to be the total taxable value of land and additions on the property. | Land | Improvement |
|---|---|---|---|---|
| 2025 | $40 | $426,400 | $178,800 | $247,600 |
| 2024 | $3,825 | $414,400 | $178,800 | $235,600 |
| 2023 | $3,818 | $383,700 | $165,700 | $218,000 |
| 2022 | $3,754 | $367,300 | $157,900 | $209,400 |
| 2021 | $3,573 | $316,500 | $143,500 | $173,000 |
| 2020 | $3,429 | $310,000 | $137,000 | $173,000 |
| 2019 | $3,320 | $284,500 | $124,700 | $159,800 |
| 2018 | $3,150 | $268,100 | $118,700 | $149,400 |
| 2017 | $3,089 | $256,600 | $118,700 | $137,900 |
| 2016 | $2,984 | $245,000 | $118,700 | $126,300 |
| 2015 | $2,923 | $240,600 | $118,700 | $121,900 |
Source: Public Records
Map
Nearby Homes
- 32 Cedar St
- 32 Green St
- 2 Washburn Ave
- 11 Lawton St
- 17 Middle St
- 24 Middle St
- 81 Washington St
- 58 Washington St
- 0 Nulands Neck Unit 73286360
- 8 Washington St
- 8 Washington St
- 145 Pleasant St
- 8 Manor Dr
- 39 Christian St
- 77 Adams St
- 181 Washington St
- 58 Bayview Ave
- 27 Bayview Ave
- 230 Green St
- 15 Bayview Ave