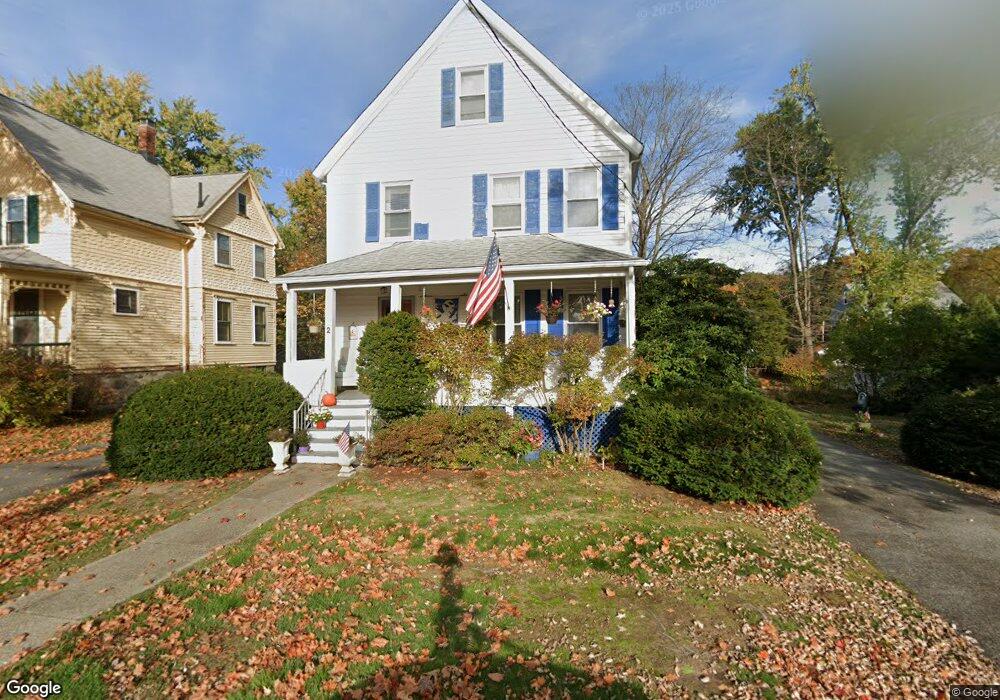
2 Maple Way Wakefield, MA 01880
Greenwood NeighborhoodEstimated Value: $663,000 - $704,238
4
Beds
1
Bath
1,424
Sq Ft
$477/Sq Ft
Est. Value
About This Home
This home is located at 2 Maple Way, Wakefield, MA 01880 and is currently estimated at $679,310, approximately $477 per square foot. 2 Maple Way is a home located in Middlesex County with nearby schools including Wakefield Memorial High School, St Joseph School, and St. Patrick Elementary School.
Ownership History
Date
Name
Owned For
Owner Type
Purchase Details
Closed on
Dec 4, 2013
Sold by
Burke Joeby R Est
Bought by
Charlotte M Burke Mari
Current Estimated Value
Purchase Details
Closed on
Nov 6, 2013
Sold by
Joeby and Joeby Charlotte Burke
Bought by
Burke Joeby R Est
Purchase Details
Closed on
Jan 8, 2010
Sold by
Joeby and Joeby Charlotte Burke
Bought by
Burke Tr Joeby R and Burke Charlotte M
Purchase Details
Closed on
Sep 12, 1962
Bought by
Charlotte Burke Marital T
Create a Home Valuation Report for This Property
The Home Valuation Report is an in-depth analysis detailing your home's value as well as a comparison with similar homes in the area
Home Values in the Area
Average Home Value in this Area
Purchase History
| Date | Buyer | Sale Price | Title Company |
|---|---|---|---|
| Charlotte M Burke Mari | -- | -- | |
| Burke Joeby R Est | -- | -- | |
| Burke Tr Joeby R | -- | -- | |
| Charlotte Burke Marital T | -- | -- |
Source: Public Records
Mortgage History
| Date | Status | Borrower | Loan Amount |
|---|---|---|---|
| Previous Owner | Charlotte Burke Marital T | $34,000 | |
| Previous Owner | Charlotte Burke Marital T | $35,000 |
Source: Public Records
Tax History
| Year | Tax Paid | Tax Assessment Tax Assessment Total Assessment is a certain percentage of the fair market value that is determined by local assessors to be the total taxable value of land and additions on the property. | Land | Improvement |
|---|---|---|---|---|
| 2025 | $7,532 | $663,600 | $384,700 | $278,900 |
| 2024 | $6,948 | $617,600 | $357,800 | $259,800 |
| 2023 | $6,767 | $576,900 | $334,000 | $242,900 |
| 2022 | $6,352 | $515,600 | $298,200 | $217,400 |
| 2021 | $6,212 | $488,000 | $272,600 | $215,400 |
| 2020 | $5,842 | $457,500 | $255,600 | $201,900 |
| 2019 | $5,480 | $427,100 | $238,600 | $188,500 |
| 2018 | $5,285 | $408,100 | $227,900 | $180,200 |
| 2017 | $4,970 | $381,400 | $213,000 | $168,400 |
| 2016 | $5,055 | $374,700 | $210,300 | $164,400 |
| 2015 | $4,723 | $350,400 | $196,500 | $153,900 |
| 2014 | $4,369 | $341,900 | $191,700 | $150,200 |
Source: Public Records
Map
Nearby Homes
- 824 Main St Unit 1
- 1 Sidney St
- 62 Golden Hills Rd
- 0 Everett St
- 15 Belmont Rd
- 34 Stark Ave
- 7 West St
- 9 Lovis Ave
- 61 Nahant St
- 176 Bay State Rd
- 24 Mount Zion Rd
- 12 Lovis Ave
- 11 Ludlow Ave
- 38 Morgan Ave
- 98 Boardman Ave
- 21 Herbert St Unit A
- 129 Greenwood St
- 1 Traverse St Unit E
- 38 Cranmore Ln
- 35 Richardson St Unit 2
Your Personal Tour Guide
Ask me questions while you tour the home.