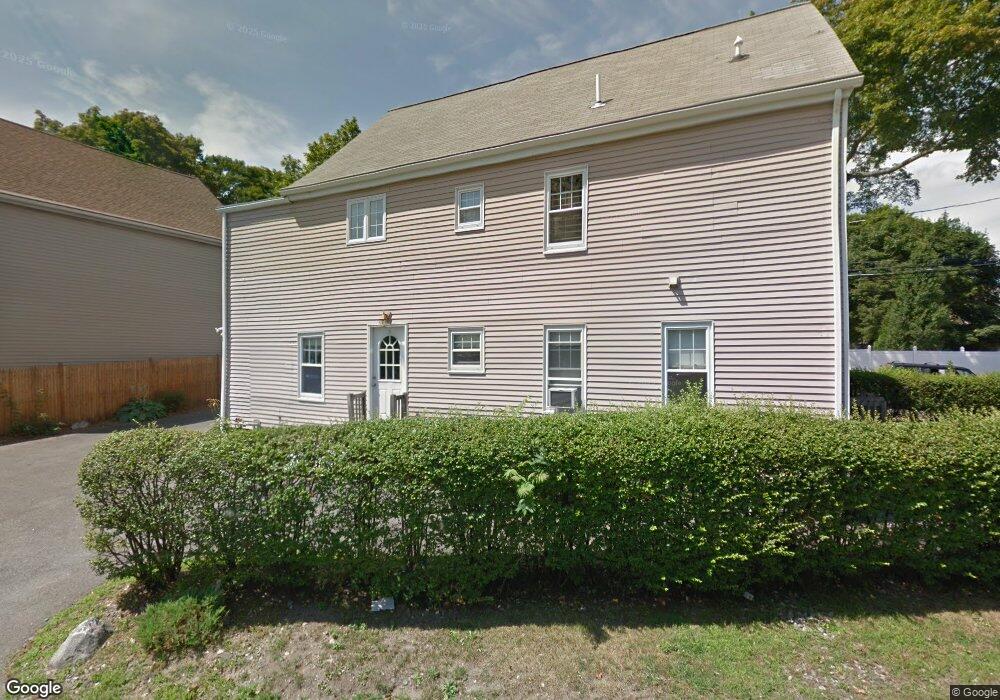
2 Melvin St Wakefield, MA 01880
East Side NeighborhoodEstimated Value: $893,000 - $1,050,633
5
Beds
4
Baths
2,569
Sq Ft
$375/Sq Ft
Est. Value
About This Home
This home is located at 2 Melvin St, Wakefield, MA 01880 and is currently estimated at $962,658, approximately $374 per square foot. 2 Melvin St is a home located in Middlesex County with nearby schools including Wakefield Memorial High School, St Joseph School, and Odyssey Day School.
Ownership History
Date
Name
Owned For
Owner Type
Purchase Details
Closed on
Jul 24, 2020
Sold by
Zabroski John A
Bought by
Zabroski John A and Zabroski Ibukunoluwapo O
Current Estimated Value
Home Financials for this Owner
Home Financials are based on the most recent Mortgage that was taken out on this home.
Original Mortgage
$510,000
Outstanding Balance
$349,822
Interest Rate
3.1%
Mortgage Type
New Conventional
Estimated Equity
$612,836
Purchase Details
Closed on
Apr 30, 2018
Sold by
Pitzi Craig M
Bought by
Zabroski John A
Home Financials for this Owner
Home Financials are based on the most recent Mortgage that was taken out on this home.
Original Mortgage
$576,000
Interest Rate
4.44%
Mortgage Type
New Conventional
Purchase Details
Closed on
Jun 7, 2010
Sold by
Roberto J P J and Roberto Karen E
Bought by
Pitzi Craig M
Home Financials for this Owner
Home Financials are based on the most recent Mortgage that was taken out on this home.
Original Mortgage
$386,791
Interest Rate
5.12%
Mortgage Type
Purchase Money Mortgage
Purchase Details
Closed on
Jun 29, 2009
Sold by
Roberto Joseph P
Bought by
Roberto J P J and Roberto Karen E
Purchase Details
Closed on
Mar 11, 2003
Sold by
Swible Walter H and Swible Roberto Joseph
Bought by
Roberto Jospeh P and Roberto Karen E
Purchase Details
Closed on
Oct 4, 1999
Sold by
Roberto Joseph P and Roberto Clara-Jane
Bought by
Roberto Joseph P and Roberto Karen
Purchase Details
Closed on
Aug 24, 1999
Sold by
Roberto Joseph P and Roberto Clara J
Bought by
Roberto David J and Roberto Margie F
Create a Home Valuation Report for This Property
The Home Valuation Report is an in-depth analysis detailing your home's value as well as a comparison with similar homes in the area
Home Values in the Area
Average Home Value in this Area
Purchase History
| Date | Buyer | Sale Price | Title Company |
|---|---|---|---|
| Zabroski John A | -- | None Available | |
| Zabroski John A | $765,000 | -- | |
| Pitzi Craig M | $392,000 | -- | |
| Pitzi Craig M | $392,000 | -- | |
| Roberto J P J | -- | -- | |
| Roberto J P J | -- | -- | |
| Roberto Jospeh P | -- | -- | |
| Roberto Jospeh P | -- | -- | |
| Roberto Joseph P | $172,000 | -- | |
| Roberto David J | $133,000 | -- |
Source: Public Records
Mortgage History
| Date | Status | Borrower | Loan Amount |
|---|---|---|---|
| Open | Zabroski John A | $510,000 | |
| Previous Owner | Zabroski John A | $576,000 | |
| Previous Owner | Pitzi Craig M | $386,791 |
Source: Public Records
Tax History
| Year | Tax Paid | Tax Assessment Tax Assessment Total Assessment is a certain percentage of the fair market value that is determined by local assessors to be the total taxable value of land and additions on the property. | Land | Improvement |
|---|---|---|---|---|
| 2025 | $10,478 | $923,200 | $326,300 | $596,900 |
| 2024 | $10,326 | $917,900 | $324,400 | $593,500 |
| 2023 | $9,819 | $837,100 | $295,900 | $541,200 |
| 2022 | $9,393 | $762,400 | $269,500 | $492,900 |
| 2021 | $9,076 | $713,000 | $251,200 | $461,800 |
| 2020 | $8,511 | $666,500 | $234,800 | $431,700 |
| 2019 | $6,434 | $501,500 | $223,300 | $278,200 |
| 2018 | $5,991 | $462,600 | $206,000 | $256,600 |
| 2017 | $5,633 | $432,300 | $192,500 | $239,800 |
| 2016 | $5,272 | $390,800 | $182,100 | $208,700 |
| 2015 | $4,924 | $365,300 | $170,200 | $195,100 |
| 2014 | $4,487 | $351,100 | $163,600 | $187,500 |
Source: Public Records
Map
Nearby Homes
- 10 Wakefield Ave Unit B
- 35 Richardson St Unit 2
- 1 Traverse St Unit E
- 21 Herbert St Unit A
- 16 Pleasant St
- 43-45 Crescent St
- 68 Preston St Unit 6D
- 61 Nahant St
- 34 Stark Ave
- 62 Foundry St Unit 310
- 62 Foundry St Unit 204
- 62 Foundry St Unit 402
- 62 Foundry St Unit 507
- 62 Foundry St Unit 208
- 62 Foundry St Unit 414
- 62 Foundry St Unit 210
- 69 Foundry St Unit 310
- 69 Foundry St Unit 416
- 0 Everett St
- 57 Wave Ave
Your Personal Tour Guide
Ask me questions while you tour the home.