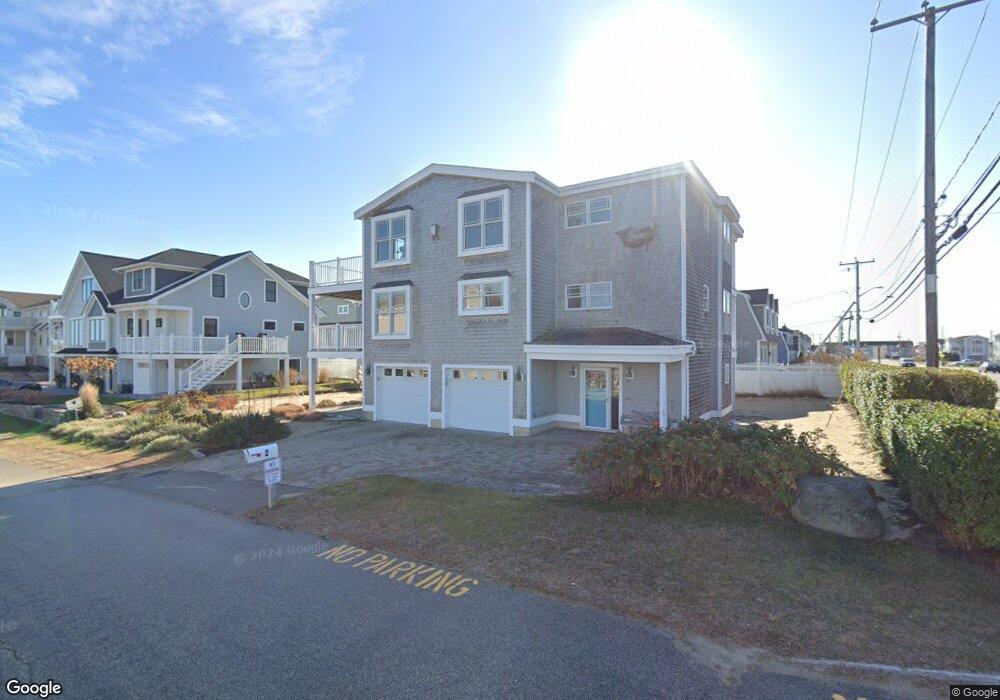
2 Merrimac St Seabrook, NH 03874
Seabrook Beach NeighborhoodEstimated Value: $1,782,000 - $2,672,000
5
Beds
3
Baths
3,677
Sq Ft
$576/Sq Ft
Est. Value
About This Home
This home is located at 2 Merrimac St, Seabrook, NH 03874 and is currently estimated at $2,116,582, approximately $575 per square foot. 2 Merrimac St is a home located in Rockingham County with nearby schools including Seabrook Elementary School, Seabrook Middle School, and Winnacunnet High School.
Ownership History
Date
Name
Owned For
Owner Type
Purchase Details
Closed on
Feb 19, 2025
Sold by
Wilkerson Lance C and Wilkerson Susan G
Bought by
Wilkerson Lt and Wilkerson
Current Estimated Value
Purchase Details
Closed on
Apr 16, 2003
Sold by
Decm Llc
Bought by
Wilkerson Lanee C and Wilkerson Susan G
Home Financials for this Owner
Home Financials are based on the most recent Mortgage that was taken out on this home.
Original Mortgage
$270,000
Interest Rate
5.75%
Mortgage Type
Purchase Money Mortgage
Create a Home Valuation Report for This Property
The Home Valuation Report is an in-depth analysis detailing your home's value as well as a comparison with similar homes in the area
Home Values in the Area
Average Home Value in this Area
Purchase History
| Date | Buyer | Sale Price | Title Company |
|---|---|---|---|
| Wilkerson Lt | -- | None Available | |
| Wilkerson Lanee C | $350,000 | -- | |
| Wilkerson Lanee C | $350,000 | -- |
Source: Public Records
Mortgage History
| Date | Status | Borrower | Loan Amount |
|---|---|---|---|
| Previous Owner | Wilkerson Lanee C | $100,000 | |
| Previous Owner | Wilkerson Lanee C | $20,000 | |
| Previous Owner | Wilkerson Lanee C | $270,000 |
Source: Public Records
Tax History Compared to Growth
Tax History
| Year | Tax Paid | Tax Assessment Tax Assessment Total Assessment is a certain percentage of the fair market value that is determined by local assessors to be the total taxable value of land and additions on the property. | Land | Improvement |
|---|---|---|---|---|
| 2024 | $16,475 | $1,405,700 | $652,200 | $753,500 |
| 2023 | $15,579 | $1,032,400 | $500,700 | $531,700 |
| 2022 | $13,679 | $1,032,400 | $500,700 | $531,700 |
| 2021 | $14,175 | $1,032,400 | $500,700 | $531,700 |
| 2020 | $11,797 | $738,700 | $400,200 | $338,500 |
| 2019 | $11,635 | $738,700 | $400,200 | $338,500 |
| 2018 | $11,669 | $718,100 | $379,600 | $338,500 |
| 2017 | $10,980 | $675,700 | $339,300 | $336,400 |
| 2016 | $9,537 | $644,800 | $308,400 | $336,400 |
| 2015 | $8,880 | $600,400 | $292,400 | $308,000 |
| 2014 | $9,168 | $600,400 | $292,400 | $308,000 |
| 2013 | $9,168 | $600,400 | $292,400 | $308,000 |
Source: Public Records
Map
Nearby Homes
- 126 Ocean Blvd
- 595 N End Blvd Unit 2
- 308 State Route 286 Unit Lot 73
- 308 State Route 286 Unit Lot 108
- 308 State Route 286 Unit Lot 23
- 308 State Route 286 Unit Lot 87
- 9 Tyngsboro St
- 376 Ocean Blvd
- 27 Cross Beach Rd
- 522 N End Blvd
- 498 N End Blvd
- 492 N End Blvd
- 308 Route 286 Unit 77
- 308 Route 286 Unit Lot 58
- 108 Ocean Dr Unit 1
- 432 N End Blvd
- 312 S Main St
- 1 Old Salt Dr
- 188 N End Blvd Unit 3
- 13-15 Ocean Blvd
- 3 Groveland St
- 9 Groveland St
- 6 Merrimac St
- 6 Merrimack St
- 11 Groveland St
- 122 Ocean Blvd
- 5 Merrimac St
- 7 Groveland St
- 130 Ocean Blvd
- 128 Ocean Blvd
- 10 Merrimac St
- 21 Groveland St
- 5 Groveland St
- 2 Groveland St
- 19 Groveland St
- 80 Ocean Blvd
- 80 Ocean Blvd Unit 3
- 134 Ocean Blvd
- 4 Groveland St
- 132 Ocean Blvd