Estimated Value: $453,578 - $526,000
3
Beds
2
Baths
1,856
Sq Ft
$260/Sq Ft
Est. Value
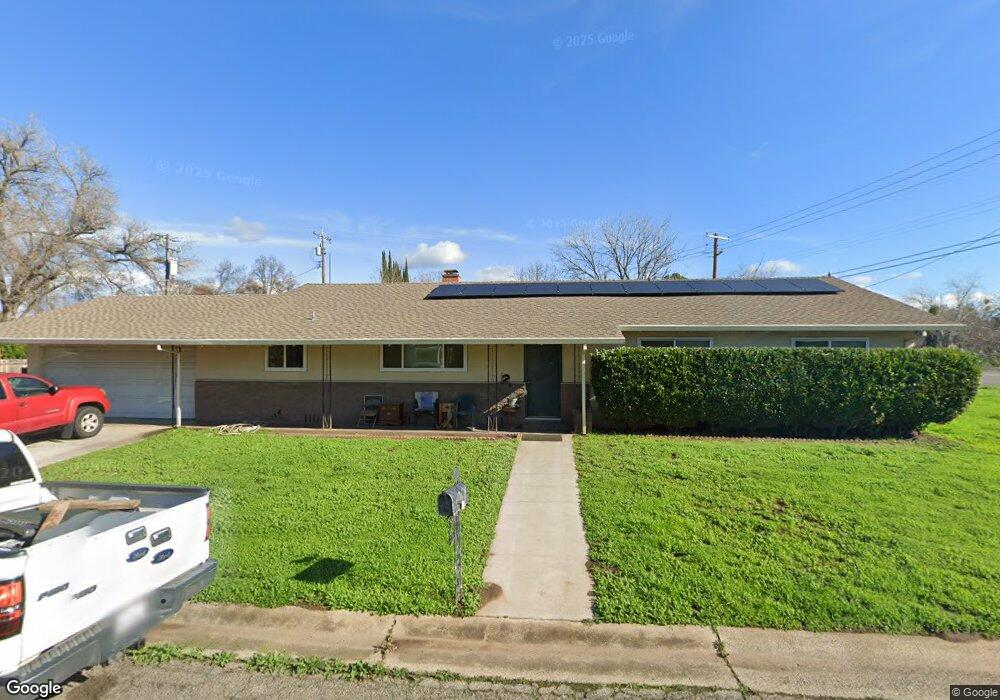
About This Home
This home is located at 2 Montclair Dr, Chico, CA 95926 and is currently estimated at $481,895, approximately $259 per square foot. 2 Montclair Dr is a home located in Butte County with nearby schools including Neal Dow Elementary School, Bidwell Junior High School, and Pleasant Valley High School.
Ownership History
Date
Name
Owned For
Owner Type
Purchase Details
Closed on
May 14, 2014
Sold by
Bryant Richard and Bryant Jill
Bought by
Bryant Christopher
Current Estimated Value
Purchase Details
Closed on
Oct 15, 2009
Sold by
Bryant Jill A
Bought by
Bryant Richard F
Home Financials for this Owner
Home Financials are based on the most recent Mortgage that was taken out on this home.
Original Mortgage
$200,000
Outstanding Balance
$130,063
Interest Rate
5%
Mortgage Type
New Conventional
Estimated Equity
$351,832
Purchase Details
Closed on
Oct 6, 2009
Sold by
Aicega Michael M
Bought by
Bryant Christopher and Bryant Richard
Home Financials for this Owner
Home Financials are based on the most recent Mortgage that was taken out on this home.
Original Mortgage
$200,000
Outstanding Balance
$130,063
Interest Rate
5%
Mortgage Type
New Conventional
Estimated Equity
$351,832
Purchase Details
Closed on
Nov 3, 2003
Sold by
Aicega Michael M and Aicega Thelma L
Bought by
Aicega Michael M
Create a Home Valuation Report for This Property
The Home Valuation Report is an in-depth analysis detailing your home's value as well as a comparison with similar homes in the area
Purchase History
| Date | Buyer | Sale Price | Title Company |
|---|---|---|---|
| Bryant Christopher | -- | None Available | |
| Bryant Richard F | -- | Fidelity Natl Title Co Of Ca | |
| Bryant Christopher | $250,000 | Fidelity Natl Title Co Of Ca | |
| Aicega Michael M | -- | -- |
Source: Public Records
Mortgage History
| Date | Status | Borrower | Loan Amount |
|---|---|---|---|
| Open | Bryant Richard F | $200,000 | |
| Closed | Bryant Christopher | $200,000 |
Source: Public Records
Tax History
| Year | Tax Paid | Tax Assessment Tax Assessment Total Assessment is a certain percentage of the fair market value that is determined by local assessors to be the total taxable value of land and additions on the property. | Land | Improvement |
|---|---|---|---|---|
| 2025 | $5,557 | $320,703 | $128,731 | $191,972 |
| 2024 | $5,557 | $314,415 | $126,207 | $188,208 |
| 2023 | $5,516 | $308,251 | $123,733 | $184,518 |
| 2022 | $5,461 | $302,207 | $121,307 | $180,900 |
| 2021 | $5,397 | $296,282 | $118,929 | $177,353 |
| 2020 | $5,388 | $293,245 | $117,710 | $175,535 |
| 2019 | $5,316 | $287,496 | $115,402 | $172,094 |
| 2018 | $5,257 | $281,860 | $113,140 | $168,720 |
| 2017 | $5,192 | $276,334 | $110,922 | $165,412 |
| 2016 | $2,854 | $270,917 | $108,748 | $162,169 |
| 2015 | $2,854 | $266,849 | $107,115 | $159,734 |
| 2014 | $2,781 | $260,000 | $110,000 | $150,000 |
Source: Public Records
Map
Nearby Homes
- 1094 Manzanita Ave
- 9 Trieste Way
- 1612 Neal Dow Ave
- 0 Us-99
- 5 Canterbury Cir
- 1415 Sheridan Ave
- 2 Canterbury Cir
- 75 Cottage Ave
- 1277 Howard Dr
- 1280 Dale Way
- 50 Casa Del Rey Ct
- 1125 Sheridan Ave Unit 37
- 1125 Sheridan Ave
- 1125 Sheridan Ave Unit 36
- 996 E 1st Ave
- 1261 Parque Dr
- 460 E 10th Ave
- 1280 Calla Ln
- 19 Via Verona Cir
- 469 E 7th Ave
- 2 Montclair Dr Unit 13
- 1076 Manzanita Ave
- 5 Montclair Dr
- 7 Montclair Dr
- 1080 Manzanita Ave
- 6 Montclair Dr
- 20 Highland Cir
- 22 Highland Cir
- 1064 Manzanita Ave
- 1082 Manzanita Ave
- 8 Montclair Dr
- 18 Highland Cir
- 10 Montclair Dr
- 1084 Manzanita Ave
- 12 Montclair Dr
- 11 Montclair Dr
- 24 Highland Cir
- 5 Seabird Ln
- 6 Seabird Ln
- 16 Highland Cir
Your Personal Tour Guide
Ask me questions while you tour the home.