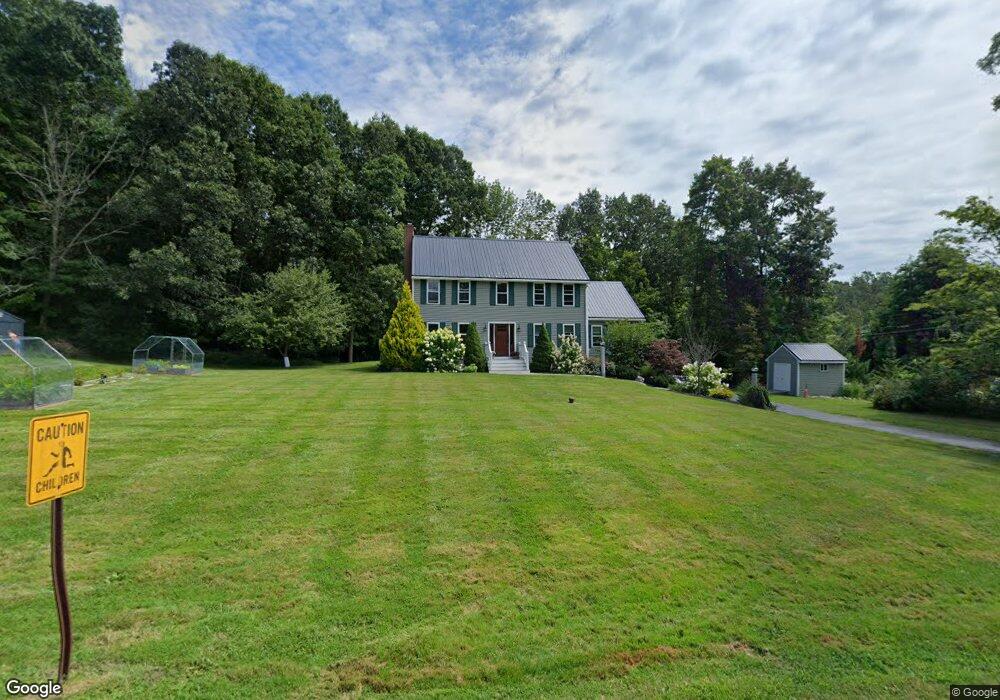
2 Morgan Way Durham, NH 03824
Estimated Value: $629,000 - $688,000
3
Beds
3
Baths
2,456
Sq Ft
$269/Sq Ft
Est. Value
About This Home
This home is located at 2 Morgan Way, Durham, NH 03824 and is currently estimated at $660,415, approximately $268 per square foot. 2 Morgan Way is a home located in Strafford County with nearby schools including Mast Way School, Oyster River Middle School, and Oyster River High School.
Ownership History
Date
Name
Owned For
Owner Type
Purchase Details
Closed on
Dec 6, 2006
Sold by
Day Barry and Day Jacqueline
Bought by
Remillong Elizabeth
Current Estimated Value
Home Financials for this Owner
Home Financials are based on the most recent Mortgage that was taken out on this home.
Original Mortgage
$267,200
Interest Rate
6.4%
Mortgage Type
Purchase Money Mortgage
Purchase Details
Closed on
Jul 30, 2002
Sold by
Owen Carla E and Owen William J
Bought by
Day Barry and Day Jacqueline
Home Financials for this Owner
Home Financials are based on the most recent Mortgage that was taken out on this home.
Original Mortgage
$229,500
Interest Rate
6.73%
Mortgage Type
Purchase Money Mortgage
Purchase Details
Closed on
Aug 14, 1997
Sold by
Pro 2000 Inc
Bought by
Owen William J and Owen Carla E
Home Financials for this Owner
Home Financials are based on the most recent Mortgage that was taken out on this home.
Original Mortgage
$110,000
Interest Rate
7.56%
Mortgage Type
Purchase Money Mortgage
Create a Home Valuation Report for This Property
The Home Valuation Report is an in-depth analysis detailing your home's value as well as a comparison with similar homes in the area
Home Values in the Area
Average Home Value in this Area
Purchase History
| Date | Buyer | Sale Price | Title Company |
|---|---|---|---|
| Remillong Elizabeth | $334,000 | -- | |
| Remillong Elizabeth | $334,000 | -- | |
| Day Barry | $255,000 | -- | |
| Owen William J | $164,000 | -- |
Source: Public Records
Mortgage History
| Date | Status | Borrower | Loan Amount |
|---|---|---|---|
| Open | Owen William J | $249,000 | |
| Closed | Remillong Elizabeth | $267,200 | |
| Previous Owner | Owen William J | $229,500 | |
| Previous Owner | Owen William J | $110,000 |
Source: Public Records
Tax History
| Year | Tax Paid | Tax Assessment Tax Assessment Total Assessment is a certain percentage of the fair market value that is determined by local assessors to be the total taxable value of land and additions on the property. | Land | Improvement |
|---|---|---|---|---|
| 2024 | $12,580 | $618,800 | $204,200 | $414,600 |
| 2023 | $12,485 | $609,600 | $204,200 | $405,400 |
| 2022 | $11,570 | $398,400 | $129,300 | $269,100 |
| 2021 | $11,125 | $398,600 | $129,500 | $269,100 |
| 2020 | $11,053 | $398,600 | $129,500 | $269,100 |
| 2019 | $10,934 | $398,600 | $129,500 | $269,100 |
| 2018 | $7,910 | $398,600 | $129,500 | $269,100 |
| 2017 | $10,473 | $341,800 | $99,600 | $242,200 |
| 2016 | $10,162 | $341,800 | $99,600 | $242,200 |
| 2015 | $10,203 | $341,800 | $99,600 | $242,200 |
| 2014 | $10,432 | $341,800 | $99,600 | $242,200 |
| 2013 | $10,394 | $341,800 | $99,600 | $242,200 |
Source: Public Records
Map
Nearby Homes
- 1 Riverview Ct
- 11 Willey Creek Rd
- 10 Young Dr
- 14 Young Dr
- 9 Young Dr
- 13 Spruce Dr
- 18 Deborah Ln
- 41 Clearwater Dr
- 36 Woodman Rd
- 3 Greenfield Dr Unit C
- 19 Lenox Dr Unit A
- Slip B18 Little Bay
- 1 Greenfield Dr
- 88 Mast Rd
- 1014 Strafford Ave
- 354 Dover Point Rd
- 348 Dover Point Rd
- 0 Cote Dr Unit 55B
- 38 Tideview Dr
- 31 Rosanna Dr
- 8 Tirrell Place
- 1 Morgan Way
- 6 Tirrell Place
- 112 Piscataqua Rd
- 116 Piscataqua Rd Unit B
- 116 Piscataqua Rd Unit A
- 116 Piscataqua Rd Unit 3
- 116 Piscataqua Rd
- 116 Piscataqua Rd Unit 116 D
- 116 Piscataqua Rd Unit 4
- 6 Morgan Way
- 4 Tirrell Place
- 9 Tirrell Place
- 118 Piscataqua Rd
- 3 Williams Way
- 4 Williams Way
- 12 Morgan Way
- 10 Morgan Way
- 7 Tirrell Place
- 5 Williams Way
Your Personal Tour Guide
Ask me questions while you tour the home.