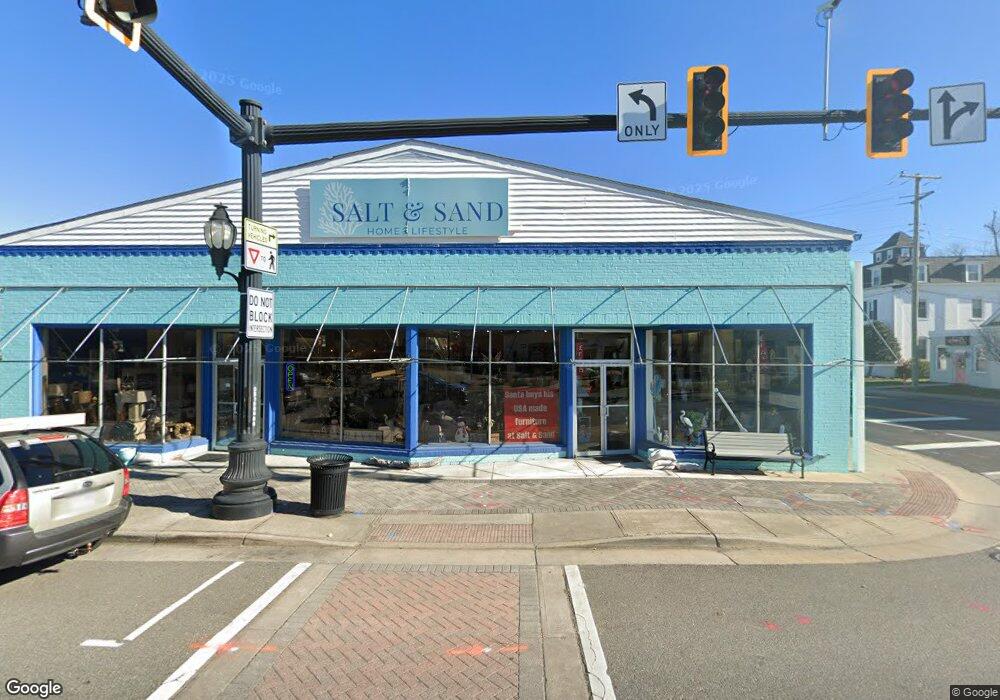
2 N Main St Kilmarnock, VA 22482
Estimated Value: $368,882
--
Bed
--
Bath
4,215
Sq Ft
$88/Sq Ft
Est. Value
About This Home
This home is located at 2 N Main St, Kilmarnock, VA 22482 and is currently estimated at $368,882, approximately $87 per square foot. 2 N Main St is a home located in Lancaster County with nearby schools including Lancaster Primary School, Lancaster Middle School, and Lancaster High School.
Ownership History
Date
Name
Owned For
Owner Type
Purchase Details
Closed on
Nov 7, 2022
Sold by
Elbourn Donald R
Bought by
Hoar Thomas Neal and Hoar Emily F
Current Estimated Value
Home Financials for this Owner
Home Financials are based on the most recent Mortgage that was taken out on this home.
Original Mortgage
$253,600
Outstanding Balance
$244,918
Interest Rate
6.92%
Mortgage Type
New Conventional
Estimated Equity
$123,964
Purchase Details
Closed on
Jun 13, 2017
Sold by
Marsh John C
Bought by
Elbourn Donald R and Elbourn Terry B
Create a Home Valuation Report for This Property
The Home Valuation Report is an in-depth analysis detailing your home's value as well as a comparison with similar homes in the area
Home Values in the Area
Average Home Value in this Area
Purchase History
| Date | Buyer | Sale Price | Title Company |
|---|---|---|---|
| Hoar Thomas Neal | $317,000 | Old Republic National Title | |
| Elbourn Donald R | $145,000 | Attorney |
Source: Public Records
Mortgage History
| Date | Status | Borrower | Loan Amount |
|---|---|---|---|
| Open | Hoar Thomas Neal | $253,600 |
Source: Public Records
Tax History Compared to Growth
Tax History
| Year | Tax Paid | Tax Assessment Tax Assessment Total Assessment is a certain percentage of the fair market value that is determined by local assessors to be the total taxable value of land and additions on the property. | Land | Improvement |
|---|---|---|---|---|
| 2025 | $1,143 | $207,800 | $54,000 | $153,800 |
| 2024 | $1,143 | $207,800 | $54,000 | $153,800 |
| 2023 | $1,073 | $170,300 | $45,000 | $125,300 |
| 2022 | $1,073 | $170,300 | $45,000 | $125,300 |
| 2021 | $1,073 | $170,300 | $45,000 | $125,300 |
| 2020 | $1,073 | $170,300 | $45,000 | $125,300 |
| 2019 | $1,073 | $170,300 | $45,000 | $125,300 |
| 2018 | $1,116 | $189,200 | $36,000 | $153,200 |
| 2017 | $1,116 | $189,200 | $36,000 | $153,200 |
| 2016 | -- | $189,200 | $36,000 | $153,200 |
| 2014 | -- | $0 | $0 | $0 |
| 2013 | -- | $0 | $0 | $0 |
Source: Public Records
Map
Nearby Homes
- 9 Comanchee Ln
- 90 N Main St
- 89 N Main St
- 86 Waverly Ave
- 8 Heatherfield Ct
- 200 Irvington Rd
- Lot 1 Waverly Ave
- Lot 3 Waverly Ave
- Lot 2 Waverly Ave
- 300 Irvington Rd
- 301 E Church St
- 230 Roseneath Ave
- 34A/39A Irvington Rd
- 21-16 Irvington Rd
- 153 Walnut St
- 161 Walnut St
- 162 Hatton Ave
- 41 Raleigh Dr
- 99 Byway Cir
- 37 Oakland St