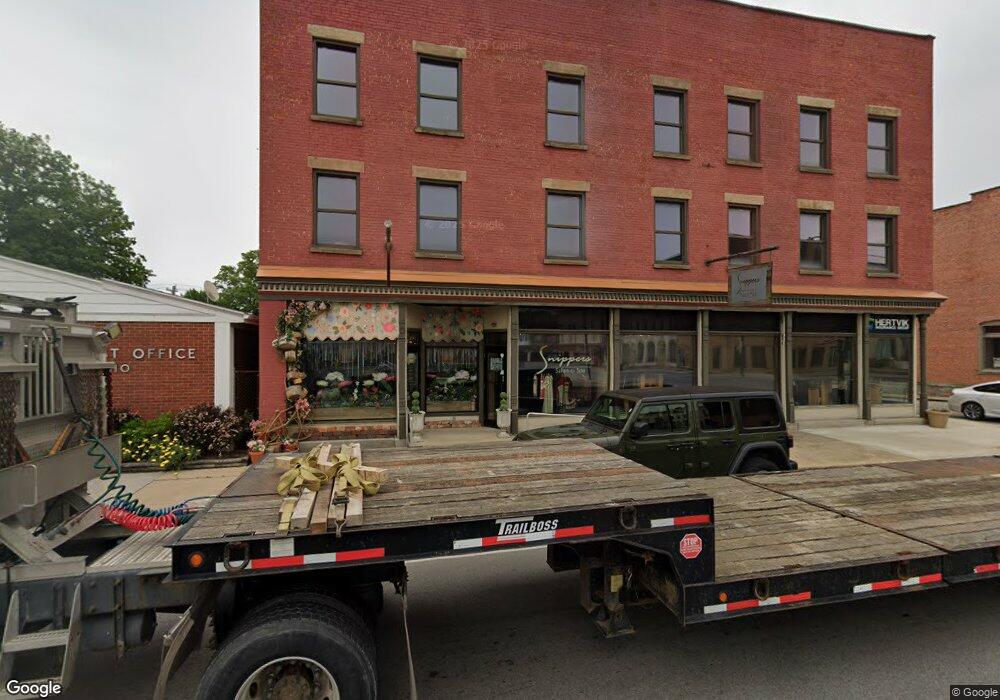
2 N Main St Monroeville, OH 44847
Estimated Value: $405,466
Studio
--
Bath
11,873
Sq Ft
$34/Sq Ft
Est. Value
About This Home
This home is located at 2 N Main St, Monroeville, OH 44847 and is currently estimated at $405,466, approximately $34 per square foot. 2 N Main St is a home located in Huron County with nearby schools including Monroeville Elementary School, Monroeville High School, and St Joseph Catholic School.
Ownership History
Date
Name
Owned For
Owner Type
Purchase Details
Closed on
Jul 31, 2024
Sold by
2 N Main St Co Llc
Bought by
Wm 1 Corporation
Current Estimated Value
Purchase Details
Closed on
Dec 12, 2003
Bought by
2 North Main St Co Llc
Purchase Details
Closed on
Dec 29, 1997
Bought by
Monroeville Village Of
Purchase Details
Closed on
Mar 11, 1997
Bought by
Betschman Dolores C
Purchase Details
Closed on
Jan 27, 1995
Bought by
Betschman Dolores C
Create a Home Valuation Report for This Property
The Home Valuation Report is an in-depth analysis detailing your home's value as well as a comparison with similar homes in the area
Purchase History
| Date | Buyer | Sale Price | Title Company |
|---|---|---|---|
| Wm 1 Corporation | $390,000 | None Listed On Document | |
| 2 North Main St Co Llc | -- | -- | |
| Monroeville Village Of | -- | -- | |
| Betschman Dolores C | -- | -- | |
| Betschman Dolores C | -- | -- |
Source: Public Records
Tax History
| Year | Tax Paid | Tax Assessment Tax Assessment Total Assessment is a certain percentage of the fair market value that is determined by local assessors to be the total taxable value of land and additions on the property. | Land | Improvement |
|---|---|---|---|---|
| 2024 | $2,283 | $30,470 | $5,590 | $24,880 |
| 2023 | $1,458 | $29,560 | $5,590 | $23,970 |
| 2022 | $1,536 | $29,560 | $5,590 | $23,970 |
| 2021 | $1,514 | $29,560 | $5,590 | $23,970 |
| 2020 | $1,526 | $29,560 | $5,590 | $23,970 |
| 2019 | $1,528 | $29,560 | $5,590 | $23,970 |
| 2018 | $1,479 | $29,560 | $5,590 | $23,970 |
| 2017 | $1,472 | $30,170 | $5,590 | $24,580 |
| 2016 | $1,454 | $30,170 | $5,590 | $24,580 |
| 2015 | $1,485 | $30,180 | $5,600 | $24,580 |
| 2014 | $1,337 | $30,140 | $5,600 | $24,540 |
| 2013 | $1,400 | $30,140 | $5,600 | $24,540 |
Source: Public Records
Map
Nearby Homes
Your Personal Tour Guide
Ask me questions while you tour the home.