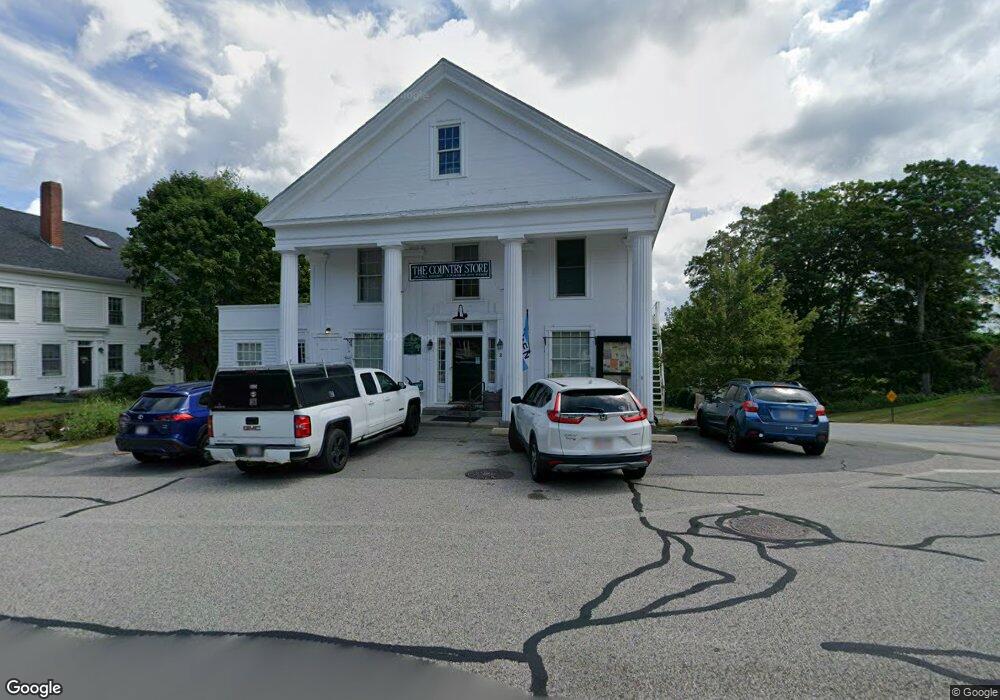
2 N Main St Petersham, MA 01366
Estimated Value: $660,514
2
Beds
2
Baths
7,500
Sq Ft
$88/Sq Ft
Est. Value
About This Home
This home is located at 2 N Main St, Petersham, MA 01366 and is currently estimated at $660,514, approximately $88 per square foot. 2 N Main St is a home located in Worcester County with nearby schools including Petersham Center, Ralph C Mahar Regional, and Petersham Montessori School.
Ownership History
Date
Name
Owned For
Owner Type
Purchase Details
Closed on
Dec 10, 2013
Sold by
Berube Charles B and Berube Sherry L
Bought by
Country Store Rt
Current Estimated Value
Purchase Details
Closed on
Mar 28, 2005
Sold by
Country Store Rt and Berube Charles B
Bought by
Polus Ctr For Social&E
Home Financials for this Owner
Home Financials are based on the most recent Mortgage that was taken out on this home.
Original Mortgage
$280,000
Interest Rate
5.56%
Mortgage Type
Commercial
Create a Home Valuation Report for This Property
The Home Valuation Report is an in-depth analysis detailing your home's value as well as a comparison with similar homes in the area
Home Values in the Area
Average Home Value in this Area
Purchase History
| Date | Buyer | Sale Price | Title Company |
|---|---|---|---|
| Country Store Rt | -- | -- | |
| In East Quabbin Land T | $312,000 | -- | |
| Polus Ctr For Social&E | $285,000 | -- |
Source: Public Records
Mortgage History
| Date | Status | Borrower | Loan Amount |
|---|---|---|---|
| Previous Owner | Country Store Rt | $889,000 | |
| Previous Owner | Polus Ctr For Social&E | $280,000 |
Source: Public Records
Tax History Compared to Growth
Tax History
| Year | Tax Paid | Tax Assessment Tax Assessment Total Assessment is a certain percentage of the fair market value that is determined by local assessors to be the total taxable value of land and additions on the property. | Land | Improvement |
|---|---|---|---|---|
| 2025 | $4,872 | $336,200 | $44,400 | $291,800 |
| 2024 | $3,524 | $246,400 | $33,200 | $213,200 |
| 2023 | $3,891 | $246,400 | $33,200 | $213,200 |
| 2022 | $3,336 | $246,400 | $33,200 | $213,200 |
| 2021 | $3,772 | $246,400 | $33,200 | $213,200 |
| 2020 | $4,280 | $246,400 | $33,200 | $213,200 |
| 2019 | $3,953 | $233,500 | $31,100 | $202,400 |
| 2018 | $3,804 | $232,400 | $30,000 | $202,400 |
| 2017 | $3,777 | $233,300 | $30,900 | $202,400 |
| 2016 | $3,831 | $233,300 | $30,900 | $202,400 |
| 2015 | $4,088 | $240,600 | $30,900 | $209,700 |
| 2014 | $3,833 | $240,600 | $30,900 | $209,700 |
Source: Public Records
Map
Nearby Homes
- 15 Common St
- 19&21 Common St
- 32 West St
- 42 New Salem Rd
- 27 Popple Camp Rd
- 163 Hardwick Rd
- 0 Popple Camp Rd Unit 73432026
- 42 Glasheen Rd
- 204 East St
- 11-L New Athol Rd
- 12-L New Athol Rd
- 7-L New Athol Rd
- 47 Harty Dr
- 0 Nichewaug Rd
- 32 Edward Ln
- 31 Edward Ln
- 37 Gauthier Rd
- 20 Dana Rd
- Back Lot 0 Petersham Rd
- 1327 Riceville Rd