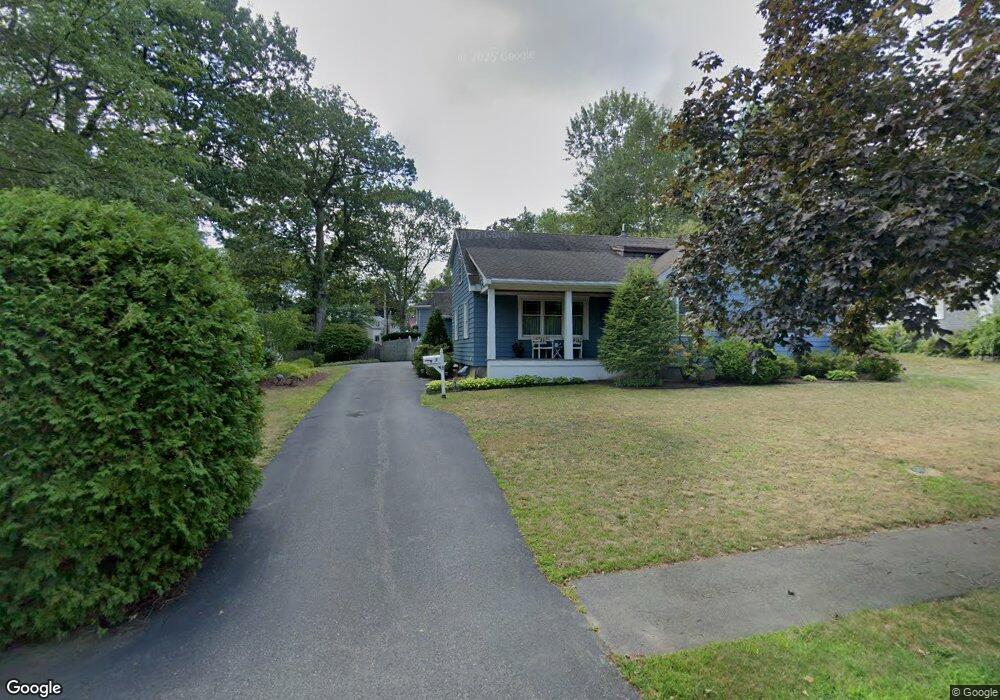
2 Neal Rd Danvers, MA 01923
Estimated Value: $841,272 - $982,000
5
Beds
3
Baths
2,377
Sq Ft
$379/Sq Ft
Est. Value
About This Home
This home is located at 2 Neal Rd, Danvers, MA 01923 and is currently estimated at $900,318, approximately $378 per square foot. 2 Neal Rd is a home located in Essex County with nearby schools including St. Mary of the Annunciation School and St. John's Prep.
Ownership History
Date
Name
Owned For
Owner Type
Purchase Details
Closed on
Jun 16, 2010
Sold by
Giblin Joanne M
Bought by
Pelletier Marc W and Pelletier Mary E
Current Estimated Value
Home Financials for this Owner
Home Financials are based on the most recent Mortgage that was taken out on this home.
Original Mortgage
$220,000
Outstanding Balance
$147,878
Interest Rate
5.03%
Mortgage Type
Purchase Money Mortgage
Estimated Equity
$752,440
Purchase Details
Closed on
Oct 1, 2009
Sold by
Giblin Vincent A
Bought by
Giblin Joanne M
Purchase Details
Closed on
Nov 4, 2008
Sold by
Sullivan Audrey L and Sullivan Lawrence R
Bought by
Giblin Vincent A and Giblin Joanne M
Home Financials for this Owner
Home Financials are based on the most recent Mortgage that was taken out on this home.
Original Mortgage
$366,208
Interest Rate
5.83%
Mortgage Type
Purchase Money Mortgage
Create a Home Valuation Report for This Property
The Home Valuation Report is an in-depth analysis detailing your home's value as well as a comparison with similar homes in the area
Home Values in the Area
Average Home Value in this Area
Purchase History
| Date | Buyer | Sale Price | Title Company |
|---|---|---|---|
| Pelletier Marc W | $416,000 | -- | |
| Giblin Joanne M | -- | -- | |
| Giblin Vincent A | $399,900 | -- |
Source: Public Records
Mortgage History
| Date | Status | Borrower | Loan Amount |
|---|---|---|---|
| Open | Giblin Vincent A | $220,000 | |
| Previous Owner | Giblin Vincent A | $366,208 |
Source: Public Records
Tax History Compared to Growth
Tax History
| Year | Tax Paid | Tax Assessment Tax Assessment Total Assessment is a certain percentage of the fair market value that is determined by local assessors to be the total taxable value of land and additions on the property. | Land | Improvement |
|---|---|---|---|---|
| 2025 | $7,649 | $696,000 | $377,300 | $318,700 |
| 2024 | $7,479 | $673,200 | $371,000 | $302,200 |
| 2023 | $7,031 | $598,400 | $339,600 | $258,800 |
| 2022 | $6,960 | $549,800 | $301,800 | $248,000 |
| 2021 | $6,857 | $513,600 | $298,100 | $215,500 |
| 2020 | $7,259 | $555,800 | $298,100 | $257,700 |
| 2019 | $6,957 | $523,900 | $270,400 | $253,500 |
| 2018 | $6,773 | $500,200 | $270,400 | $229,800 |
| 2017 | $6,383 | $449,800 | $232,700 | $217,100 |
| 2016 | $6,119 | $430,900 | $220,100 | $210,800 |
| 2015 | $6,049 | $405,700 | $201,200 | $204,500 |
Source: Public Records
Map
Nearby Homes
- 12 Exeter St
- 6 Colby Rd
- 4 Chatham Ln
- 42 Coolidge Rd
- 26 Mohawk St
- 78 North St
- 4 Brookvale Dr
- 3 Middlewood Dr Unit 3
- 35 Locust St Unit 3
- 1 Morgan Dr
- 11 Spring St
- 100 Poplar St
- 10 Colantoni Dr
- 6 Kimberly Dr
- 12 Whipple St
- 25 Cherry St Unit 3
- 8 Putnam St Unit 3
- 38 High St Unit 4
- 35 High St Unit 3D
- 14 Williams St Unit C17