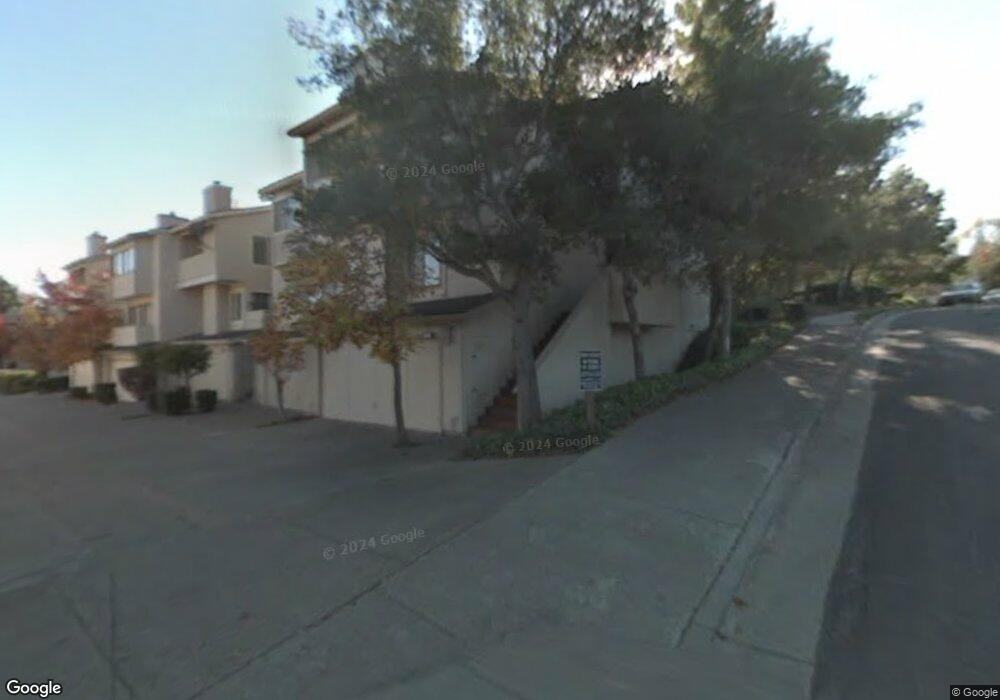
2 Needleridge Ct San Mateo, CA 94402
Tobin Clark Estate NeighborhoodEstimated Value: $1,487,000 - $1,924,000
3
Beds
4
Baths
2,030
Sq Ft
$823/Sq Ft
Est. Value
About This Home
This home is located at 2 Needleridge Ct, San Mateo, CA 94402 and is currently estimated at $1,671,624, approximately $823 per square foot. 2 Needleridge Ct is a home located in San Mateo County with nearby schools including Highlands Elementary School, Borel Middle School, and Aragon High School.
Ownership History
Date
Name
Owned For
Owner Type
Purchase Details
Closed on
Dec 20, 2011
Sold by
Yang Chun Mei and Pai Chi Yun
Bought by
Yang Chun Mei and Pai Chi Yun
Current Estimated Value
Home Financials for this Owner
Home Financials are based on the most recent Mortgage that was taken out on this home.
Original Mortgage
$407,000
Outstanding Balance
$277,478
Interest Rate
3.94%
Mortgage Type
New Conventional
Estimated Equity
$1,394,146
Purchase Details
Closed on
Mar 21, 2007
Sold by
Portman Mary S and Portman William J
Bought by
Yang Chun Mei and Pai Chi Yun
Home Financials for this Owner
Home Financials are based on the most recent Mortgage that was taken out on this home.
Original Mortgage
$616,000
Interest Rate
6.29%
Mortgage Type
New Conventional
Purchase Details
Closed on
Oct 20, 2005
Sold by
Portman Mary S and Portman William J
Bought by
Portman Mary S and Portman William J
Create a Home Valuation Report for This Property
The Home Valuation Report is an in-depth analysis detailing your home's value as well as a comparison with similar homes in the area
Home Values in the Area
Average Home Value in this Area
Purchase History
| Date | Buyer | Sale Price | Title Company |
|---|---|---|---|
| Yang Chun Mei | -- | Fidelity National Title Co | |
| Yang Chun Mei | $770,000 | First American Title Company | |
| Portman Mary S | -- | -- |
Source: Public Records
Mortgage History
| Date | Status | Borrower | Loan Amount |
|---|---|---|---|
| Open | Yang Chun Mei | $407,000 | |
| Closed | Yang Chun Mei | $616,000 |
Source: Public Records
Tax History
| Year | Tax Paid | Tax Assessment Tax Assessment Total Assessment is a certain percentage of the fair market value that is determined by local assessors to be the total taxable value of land and additions on the property. | Land | Improvement |
|---|---|---|---|---|
| 2025 | $12,950 | $1,031,622 | $515,811 | $515,811 |
| 2023 | $12,950 | $991,566 | $495,783 | $495,783 |
| 2022 | $12,661 | $972,124 | $486,062 | $486,062 |
| 2021 | $12,401 | $953,064 | $476,532 | $476,532 |
| 2020 | $11,846 | $943,292 | $471,646 | $471,646 |
| 2019 | $11,530 | $924,798 | $462,399 | $462,399 |
| 2018 | $10,893 | $906,666 | $453,333 | $453,333 |
| 2017 | $10,501 | $888,890 | $444,445 | $444,445 |
| 2016 | $10,501 | $871,462 | $435,731 | $435,731 |
| 2015 | $10,155 | $858,372 | $429,186 | $429,186 |
| 2014 | $9,845 | $841,558 | $420,779 | $420,779 |
Source: Public Records
Map
Nearby Homes
- 18 Tollridge Ct
- 6 Havenridge Ct
- 42 Lyonridge Ln
- 1581 Ascension Dr
- 18 Bel Aire Ln
- 1521 Cherrywood Dr
- 15 Amy Dr
- 3400 Douglas Ct
- 2324 Red Oak Ct
- 2459 Willow Way
- 2322 Red Oak Ct
- 2449 Willow Way
- 3334 Caxton Ct
- 2439 Willow Way
- 2312 Red Oak Ct
- 2737 Tiburon St
- 2747 Tiburon St
- 8 Bel Aire Rd
- 2419 Willow Way
- 1215 Tournament Dr
- 6 Needleridge Ct
- 10 Needleridge Ct
- 14 Needleridge Ct
- 1 Gallowridge Ct
- 18 Needleridge Ct
- 5 Gallowridge Ct
- 5 Needleridge Ct
- 9 Needleridge Ct
- 13 Needleridge Ct
- 9 Gallowridge Ct
- 17 Needleridge Ct
- 13 Gallowridge Ct
- 21 Needleridge Ct
- 37 Weepingridge Ct
- 1630 Bayridge Way
- 1632 Bayridge Way
- 46 Tollridge Ct
- 33 Weepingridge Ct
- 1634 Bayridge Way
- 42 Tollridge Ct
Your Personal Tour Guide
Ask me questions while you tour the home.