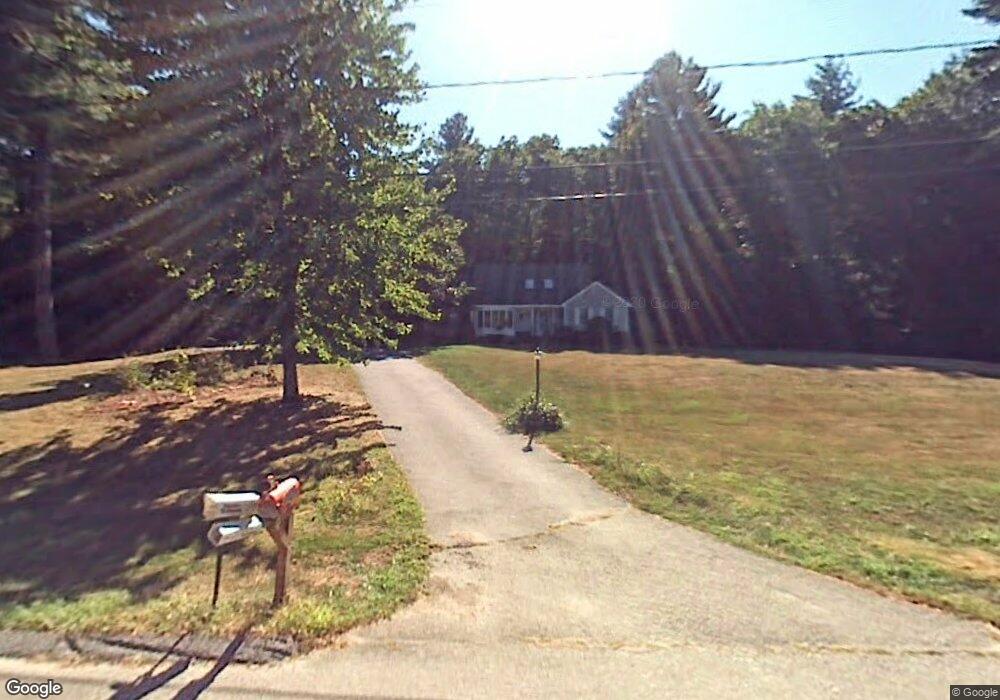
2 Noyes Ln Atkinson, NH 03811
Estimated Value: $741,466 - $1,141,000
4
Beds
3
Baths
3,077
Sq Ft
$285/Sq Ft
Est. Value
About This Home
This home is located at 2 Noyes Ln, Atkinson, NH 03811 and is currently estimated at $877,867, approximately $285 per square foot. 2 Noyes Ln is a home located in Rockingham County with nearby schools including Atkinson Academy, Timberlane Regional Middle School, and Timberlane Regional High School.
Ownership History
Date
Name
Owned For
Owner Type
Purchase Details
Closed on
Oct 23, 2001
Sold by
Stone Gordon L and Stone Janet M
Bought by
Costigan John S and Costigan Kathleen M
Current Estimated Value
Home Financials for this Owner
Home Financials are based on the most recent Mortgage that was taken out on this home.
Original Mortgage
$275,000
Outstanding Balance
$107,881
Interest Rate
6.92%
Estimated Equity
$769,986
Create a Home Valuation Report for This Property
The Home Valuation Report is an in-depth analysis detailing your home's value as well as a comparison with similar homes in the area
Home Values in the Area
Average Home Value in this Area
Purchase History
| Date | Buyer | Sale Price | Title Company |
|---|---|---|---|
| Costigan John S | $430,000 | -- |
Source: Public Records
Mortgage History
| Date | Status | Borrower | Loan Amount |
|---|---|---|---|
| Open | Costigan John S | $275,000 |
Source: Public Records
Tax History
| Year | Tax Paid | Tax Assessment Tax Assessment Total Assessment is a certain percentage of the fair market value that is determined by local assessors to be the total taxable value of land and additions on the property. | Land | Improvement |
|---|---|---|---|---|
| 2024 | $8,151 | $630,900 | $288,100 | $342,800 |
| 2023 | $9,148 | $630,900 | $288,100 | $342,800 |
| 2022 | $7,741 | $630,900 | $288,100 | $342,800 |
| 2021 | $7,798 | $630,900 | $288,100 | $342,800 |
| 2020 | $7,905 | $431,000 | $192,100 | $238,900 |
| 2019 | $7,616 | $431,000 | $192,100 | $238,900 |
| 2018 | $7,728 | $431,000 | $192,100 | $238,900 |
| 2017 | $7,887 | $431,000 | $192,100 | $238,900 |
| 2016 | $7,706 | $431,000 | $192,100 | $238,900 |
| 2015 | $7,661 | $401,100 | $186,100 | $215,000 |
| 2014 | $7,661 | $401,100 | $186,100 | $215,000 |
| 2013 | $7,621 | $401,100 | $186,100 | $215,000 |
Source: Public Records
Map
Nearby Homes
- 5 Sycamore Ct
- 6 Dogwood Ct
- 38 East Rd
- 7 Wason Ln
- 5 Whiton Place
- 22 W Pine St
- 207 Oak Ridge Rd
- 42 Plaistow Rd
- 32 Main St
- 34 Bel's Way
- 40 Meditation Ln
- 0 Plaistow Rd Unit 73184617
- 13 Cottonwood Rd
- 41 Main St
- 15 Angie Ave
- 15 Marilyn Dr
- 8 Iris Way Unit 8
- 22 Iris Way Unit 4-22
- 51 Front Nine Dr
- 15 Canterbury Forest Unit B
Your Personal Tour Guide
Ask me questions while you tour the home.