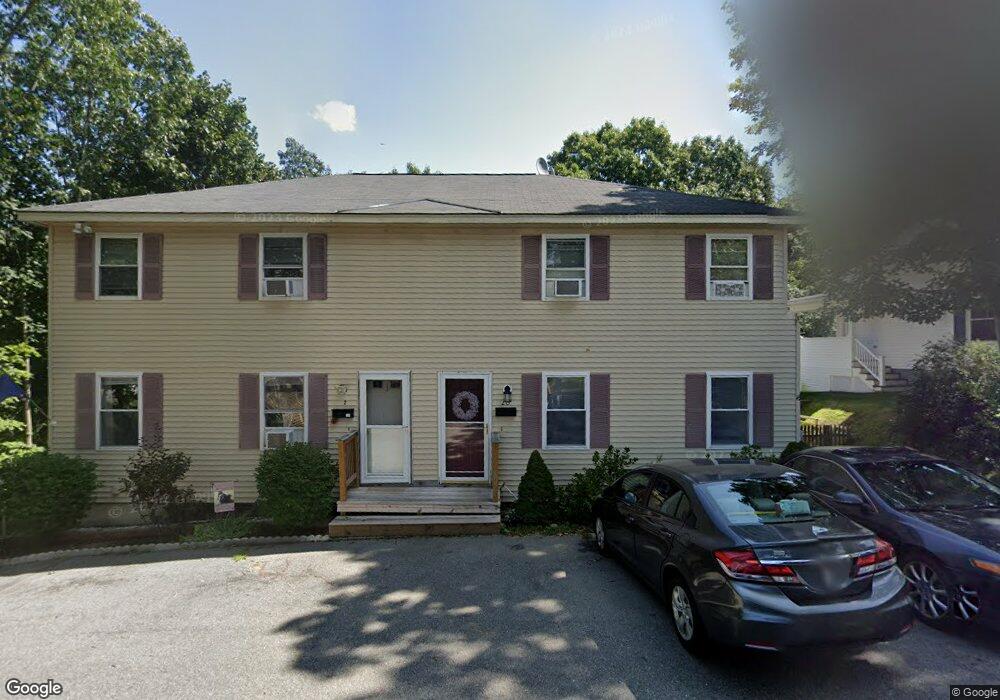
2 Nutt St Nashua, NH 03060
Southeast Nashua NeighborhoodEstimated Value: $382,000 - $411,000
3
Beds
1
Bath
1,242
Sq Ft
$318/Sq Ft
Est. Value
About This Home
This home is located at 2 Nutt St, Nashua, NH 03060 and is currently estimated at $395,226, approximately $318 per square foot. 2 Nutt St is a home located in Hillsborough County with nearby schools including Sunset Heights Elementary School, Elm Street Middle School, and Nashua High School North.
Ownership History
Date
Name
Owned For
Owner Type
Purchase Details
Closed on
Mar 26, 2025
Sold by
Diamond Hill Nh Prop Llc
Bought by
Deluca Paul R and Deluca Nicholas J
Current Estimated Value
Home Financials for this Owner
Home Financials are based on the most recent Mortgage that was taken out on this home.
Original Mortgage
$300,000
Outstanding Balance
$298,464
Interest Rate
6.87%
Mortgage Type
Purchase Money Mortgage
Estimated Equity
$96,762
Purchase Details
Closed on
Aug 26, 2024
Sold by
Callahan Christopher and Pennymac Loan Svcs Llc
Bought by
Diamond Hill Nh Prop Llc
Purchase Details
Closed on
Oct 18, 2019
Sold by
Isaacs Stephen L and Isaacs Kelley L
Bought by
Callahan Christopher
Home Financials for this Owner
Home Financials are based on the most recent Mortgage that was taken out on this home.
Original Mortgage
$225,735
Interest Rate
3.4%
Mortgage Type
FHA
Purchase Details
Closed on
Mar 30, 2010
Sold by
Deutsche Bk Natl T Co
Bought by
Isaacs Stephen Lee and Isaacs Kelly Lynn
Home Financials for this Owner
Home Financials are based on the most recent Mortgage that was taken out on this home.
Original Mortgage
$132,554
Interest Rate
5.02%
Mortgage Type
Purchase Money Mortgage
Purchase Details
Closed on
Feb 2, 2010
Sold by
Goodwin Larry R and Deutsche Bk Natl T Co
Bought by
Deutsche Bk Natl T Co
Home Financials for this Owner
Home Financials are based on the most recent Mortgage that was taken out on this home.
Original Mortgage
$132,554
Interest Rate
5.02%
Mortgage Type
Purchase Money Mortgage
Purchase Details
Closed on
May 5, 2006
Sold by
Berchovich Mark M
Bought by
Goodwin Larry
Home Financials for this Owner
Home Financials are based on the most recent Mortgage that was taken out on this home.
Original Mortgage
$164,800
Interest Rate
6.34%
Mortgage Type
Purchase Money Mortgage
Create a Home Valuation Report for This Property
The Home Valuation Report is an in-depth analysis detailing your home's value as well as a comparison with similar homes in the area
Home Values in the Area
Average Home Value in this Area
Purchase History
| Date | Buyer | Sale Price | Title Company |
|---|---|---|---|
| Deluca Paul R | $375,000 | None Available | |
| Deluca Paul R | $375,000 | None Available | |
| Diamond Hill Nh Prop Llc | $226,000 | None Available | |
| Diamond Hill Nh Prop Llc | $226,000 | None Available | |
| Diamond Hill Nh Prop Llc | $226,000 | None Available | |
| Callahan Christopher | $229,933 | -- | |
| Isaacs Stephen Lee | $135,000 | -- | |
| Isaacs Stephen Lee | $135,000 | -- | |
| Deutsche Bk Natl T Co | $136,000 | -- | |
| Deutsche Bk Natl T Co | $136,000 | -- | |
| Goodwin Larry | $206,000 | -- | |
| Goodwin Larry | $206,000 | -- |
Source: Public Records
Mortgage History
| Date | Status | Borrower | Loan Amount |
|---|---|---|---|
| Open | Deluca Paul R | $300,000 | |
| Closed | Deluca Paul R | $300,000 | |
| Previous Owner | Callahan Christopher | $225,735 | |
| Previous Owner | Goodwin Larry | $132,554 | |
| Previous Owner | Goodwin Larry | $164,800 |
Source: Public Records
Tax History Compared to Growth
Tax History
| Year | Tax Paid | Tax Assessment Tax Assessment Total Assessment is a certain percentage of the fair market value that is determined by local assessors to be the total taxable value of land and additions on the property. | Land | Improvement |
|---|---|---|---|---|
| 2024 | $5,101 | $320,800 | $0 | $320,800 |
| 2023 | $5,453 | $299,100 | $0 | $299,100 |
| 2022 | $5,405 | $299,100 | $0 | $299,100 |
| 2021 | $3,741 | $161,100 | $0 | $161,100 |
| 2020 | $3,581 | $158,400 | $0 | $158,400 |
| 2019 | $3,447 | $158,400 | $0 | $158,400 |
| 2018 | $3,360 | $158,400 | $0 | $158,400 |
| 2017 | $3,538 | $137,200 | $0 | $137,200 |
| 2016 | $3,440 | $137,200 | $0 | $137,200 |
| 2015 | $3,366 | $137,200 | $0 | $137,200 |
| 2014 | $3,300 | $137,200 | $0 | $137,200 |
Source: Public Records
Map
Nearby Homes
- 1 Circle Ave
- 27 Fifield St Unit 13
- 2 Lyons St
- 15 Lovell St Unit 3
- 15 Lovell St Unit 10
- 24 E Otterson St
- 65 Allds St
- 5 Mulberry St
- 13 Mulvanity St
- 8 Buck St Unit 10
- 6 Hayden St
- 36 Eastman St Unit 26
- 63 Dexter St
- 22 Wilder St
- 15 Learned St Unit 123
- 97 Linwood St
- 76 Gillis St
- 4 Badger St
- 38 Central St
- 17 Herrick St