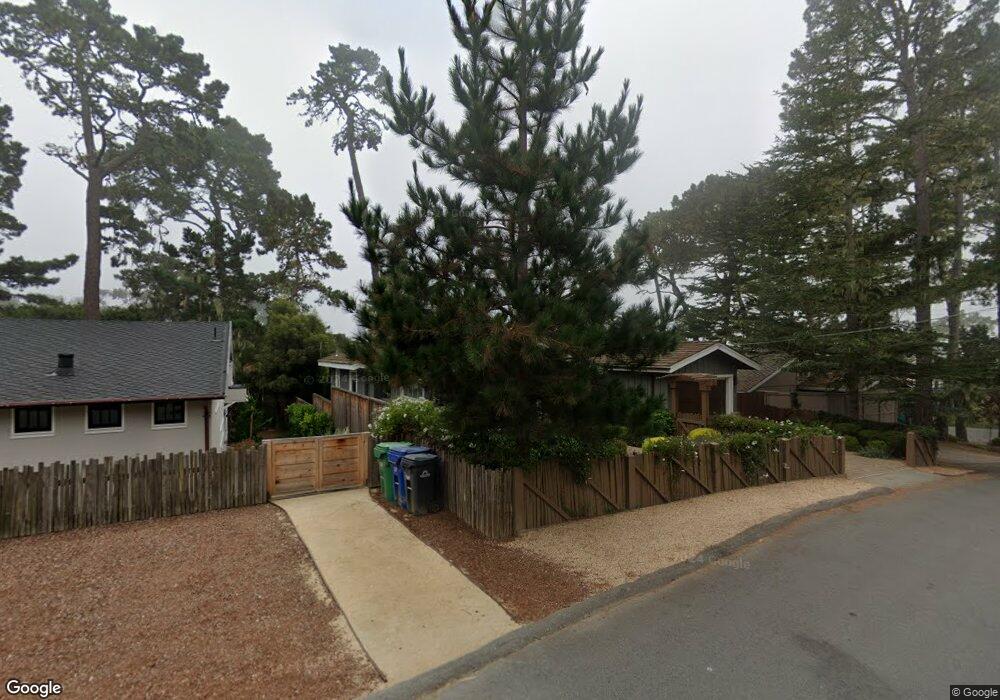
2 NW San Carlos St Carmel, CA 93923
Carmel-By-The-Sea NeighborhoodEstimated Value: $4,681,000 - $5,318,000
5
Beds
4
Baths
2,854
Sq Ft
$1,752/Sq Ft
Est. Value
About This Home
This home is located at 2 NW San Carlos St, Carmel, CA 93923 and is currently estimated at $4,999,500, approximately $1,751 per square foot. 2 NW San Carlos St is a home with nearby schools including Carmel River Elementary School, Carmel Middle School, and Carmel High School.
Ownership History
Date
Name
Owned For
Owner Type
Purchase Details
Closed on
Jul 23, 2021
Sold by
Finegan Maria P and Finegan Robert E
Bought by
Finegan Maria P and Finegan Robert E
Current Estimated Value
Purchase Details
Closed on
Jun 19, 2017
Sold by
Bonderman Jesse
Bought by
Finegan Robert E and Finegan Maria P
Purchase Details
Closed on
Aug 20, 2014
Sold by
Woolley Maya Fonseca
Bought by
Bonderman Jesse
Purchase Details
Closed on
Aug 18, 2014
Sold by
Livingston Barbara T
Bought by
Bonderman Jesse
Purchase Details
Closed on
Aug 23, 2005
Sold by
Livingston Barbara Timmins and Kohn Robert E
Bought by
Livingston Barbara T and Kohn Robert E
Purchase Details
Closed on
Jul 18, 1994
Sold by
Kohn Robert E
Bought by
Kohn Robert E
Create a Home Valuation Report for This Property
The Home Valuation Report is an in-depth analysis detailing your home's value as well as a comparison with similar homes in the area
Home Values in the Area
Average Home Value in this Area
Purchase History
| Date | Buyer | Sale Price | Title Company |
|---|---|---|---|
| Finegan Maria P | -- | None Available | |
| Finegan Robert E | $2,900,000 | Old Republic Title Company | |
| Bonderman Jesse | -- | Chicago Title Company | |
| Bonderman Jesse | $2,040,000 | Chicago Title Company | |
| Livingston Barbara T | -- | -- | |
| Kohn Robert E | -- | -- |
Source: Public Records
Tax History Compared to Growth
Tax History
| Year | Tax Paid | Tax Assessment Tax Assessment Total Assessment is a certain percentage of the fair market value that is determined by local assessors to be the total taxable value of land and additions on the property. | Land | Improvement |
|---|---|---|---|---|
| 2025 | $36,129 | $3,365,693 | $1,856,934 | $1,508,759 |
| 2024 | $36,129 | $3,299,700 | $1,820,524 | $1,479,176 |
| 2023 | $36,048 | $3,235,001 | $1,784,828 | $1,450,173 |
| 2022 | $35,033 | $3,171,571 | $1,749,832 | $1,421,739 |
| 2021 | $34,450 | $3,109,384 | $1,715,522 | $1,393,862 |
| 2020 | $33,703 | $3,077,502 | $1,697,932 | $1,379,570 |
| 2019 | $33,040 | $3,017,160 | $1,664,640 | $1,352,520 |
| 2018 | $32,343 | $2,958,000 | $1,632,000 | $1,326,000 |
| 2017 | $23,422 | $2,112,531 | $1,553,332 | $559,199 |
| 2016 | $22,963 | $2,071,110 | $1,522,875 | $548,235 |
| 2015 | -- | $2,040,000 | $1,500,000 | $540,000 |
| 2014 | -- | $607,928 | $286,672 | $321,256 |
Source: Public Records
Map
Nearby Homes
- 25905 Junipero Ave
- 3 Monte Verde St
- 3029 Lasuen Dr
- 26167 Valley View Ave
- 26372 Riverside Place
- 26265 Valley View Ave
- 0 Lincoln 3 Sw of 10th Ave Unit ML82025179
- 0 Carmelo 4 Sw of Ocean Ave Unit ML82022463
- 0 Mission 5 Nw of Santa Lucia St Unit ML82021232
- 0 Dolores 3 Ne of 10th St Unit ML82020056
- SW Mountain View at Crespi Ave
- 0 NE Corner 11th Avenue and Camino Real Unit ML82017316
- 0 Santa Fe 2 Nw of 3rd Ave Unit ML82014564
- 0 4th SE 4th Avenue-3 Southeast of Torres Ave
- 3 San Antonio Ave
- 2 Pine Ridge Way
- 0 5th Avenue 3 Se of Perry Newberry Way Unit ML82024518
- 0 NE Corner San Carlos & 8th Unit 1
- 0 Carpenter & 2nd Corner NW Unit ML82002239
- 3325 Sycamore Place
- 0 NE Corner San Carlos & 13th St Unit ML81989467
- 0 San Carlos St
- 0 San Carlos St Unit ML80829533
- 0 San Carlos St Unit ML80826674
- 0 San Carlos St Unit ML81041861
- 0 San Carlos St Unit ML81448713
- 0 San Carlos St Unit ML80528554
- 0 San Carlos St Unit CARLOS
- 2 SW San Carlos Tenth St
- 5 SW San Carlos 10th St
- 2 SW San Carlos 10th St
- 5 NE San Carlos & Camino Del Monte
- 1 NW San Carlos & 3rd
- 0 San Carlos St Unit 13th
- 0 San Carlos St Unit 8 SE 13th
- 0 San Carlos St Unit 4
- 0 San Carlos St Unit ML81817459
- 0 San Carlos St Unit ML81759624
- 0 San Carlos St Unit ML81728031
- 0 Dolores St