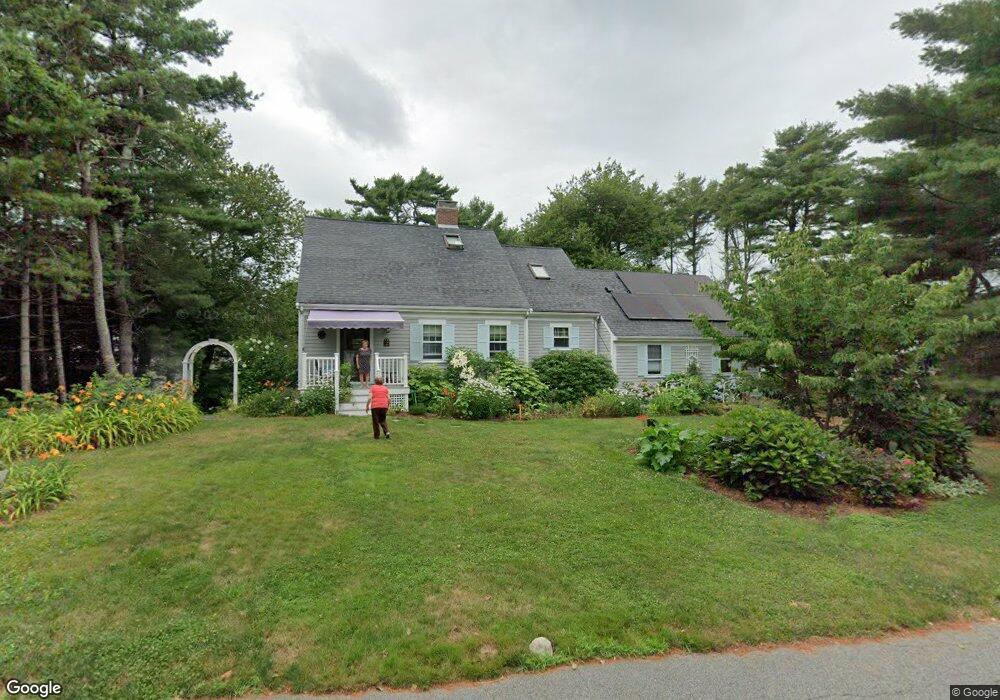
2 Oak Ridge Dr Pocasset, MA 02559
Pocasset NeighborhoodEstimated Value: $711,617 - $812,000
3
Beds
3
Baths
1,801
Sq Ft
$429/Sq Ft
Est. Value
About This Home
This home is located at 2 Oak Ridge Dr, Pocasset, MA 02559 and is currently estimated at $772,154, approximately $428 per square foot. 2 Oak Ridge Dr is a home located in Barnstable County with nearby schools including Bourne High School, Cadence Academy Preschool - Bourne, and St Margaret Regional School.
Ownership History
Date
Name
Owned For
Owner Type
Purchase Details
Closed on
Nov 6, 2017
Sold by
Volpe-Sullivan Denise
Bought by
Denise V Sullivan 2017 and Sullivan
Current Estimated Value
Purchase Details
Closed on
Feb 24, 1995
Sold by
Lopes Paul R and Lopes Marilyn B
Bought by
Bannister Catherine L and Bannister Ernest
Create a Home Valuation Report for This Property
The Home Valuation Report is an in-depth analysis detailing your home's value as well as a comparison with similar homes in the area
Home Values in the Area
Average Home Value in this Area
Purchase History
| Date | Buyer | Sale Price | Title Company |
|---|---|---|---|
| Denise V Sullivan 2017 | -- | -- | |
| Denise V Sullivan 2017 | -- | -- | |
| Bannister Catherine L | $182,500 | -- | |
| Bannister Catherine L | $182,500 | -- |
Source: Public Records
Tax History Compared to Growth
Tax History
| Year | Tax Paid | Tax Assessment Tax Assessment Total Assessment is a certain percentage of the fair market value that is determined by local assessors to be the total taxable value of land and additions on the property. | Land | Improvement |
|---|---|---|---|---|
| 2025 | $5,020 | $642,800 | $198,600 | $444,200 |
| 2024 | $4,985 | $621,600 | $198,600 | $423,000 |
| 2023 | $4,846 | $550,100 | $175,800 | $374,300 |
| 2022 | $4,511 | $447,100 | $155,500 | $291,600 |
| 2021 | $4,382 | $406,900 | $141,500 | $265,400 |
| 2020 | $4,121 | $383,700 | $140,200 | $243,500 |
| 2019 | $3,889 | $370,000 | $140,200 | $229,800 |
| 2018 | $3,744 | $355,200 | $133,500 | $221,700 |
| 2017 | $3,623 | $351,700 | $132,300 | $219,400 |
| 2016 | $3,148 | $309,800 | $126,000 | $183,800 |
| 2015 | $3,120 | $309,800 | $126,000 | $183,800 |
Source: Public Records
Map
Nearby Homes
- 940 County Rd
- 709 County Rd
- 254 Barlows Landing Rd
- 7 4th Ave
- 15 1st St
- 39 Bennets Neck Dr
- 940 County Rd
- 171 Bellavista Dr
- 14 Navajo Rd
- 41 Portside Dr
- 34 Kenwood Rd
- 70 Wings Neck Rd
- 515 County Rd
- 45 Kenwood Rd
- 22 Nairn Rd
- 3 Red Brook Pond Dr
- 48 Red Brook Harbor Rd
- 566 Shore Rd
- 30 Howard Ave
- 93 Valley Bars Rd