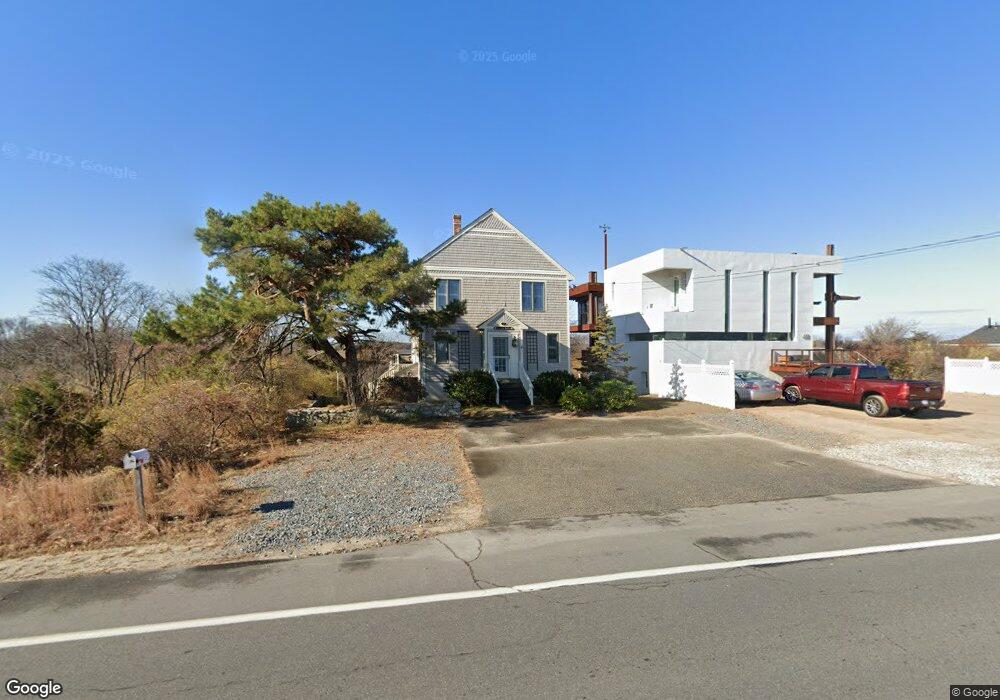
2 Ocean Blvd Unit WS Seabrook, NH 03874
Seabrook Beach NeighborhoodEstimated Value: $1,136,000 - $1,947,000
3
Beds
3
Baths
2,008
Sq Ft
$720/Sq Ft
Est. Value
About This Home
This home is located at 2 Ocean Blvd Unit WS, Seabrook, NH 03874 and is currently estimated at $1,445,170, approximately $719 per square foot. 2 Ocean Blvd Unit WS is a home located in Rockingham County with nearby schools including Seabrook Elementary School, Seabrook Middle School, and Winnacunnet High School.
Ownership History
Date
Name
Owned For
Owner Type
Purchase Details
Closed on
Sep 6, 2017
Sold by
Manzi Albert P and Manzi Kathleen A
Bought by
Salt Marsh Rt
Current Estimated Value
Home Financials for this Owner
Home Financials are based on the most recent Mortgage that was taken out on this home.
Original Mortgage
$360,000
Outstanding Balance
$292,979
Interest Rate
2.99%
Mortgage Type
Adjustable Rate Mortgage/ARM
Estimated Equity
$1,152,191
Purchase Details
Closed on
May 1, 2002
Sold by
Carlisle Catherine D
Bought by
Manzi Albert P and Manzi Kathleen A
Home Financials for this Owner
Home Financials are based on the most recent Mortgage that was taken out on this home.
Original Mortgage
$312,000
Interest Rate
7.13%
Mortgage Type
Purchase Money Mortgage
Create a Home Valuation Report for This Property
The Home Valuation Report is an in-depth analysis detailing your home's value as well as a comparison with similar homes in the area
Home Values in the Area
Average Home Value in this Area
Purchase History
| Date | Buyer | Sale Price | Title Company |
|---|---|---|---|
| Salt Marsh Rt | -- | -- | |
| Manzi Albert P | $390,000 | -- |
Source: Public Records
Mortgage History
| Date | Status | Borrower | Loan Amount |
|---|---|---|---|
| Open | Salt Marsh Rt | $360,000 | |
| Previous Owner | Manzi Albert P | $281,609 | |
| Previous Owner | Manzi Albert P | $300,000 | |
| Previous Owner | Manzi Albert P | $300,000 | |
| Previous Owner | Manzi Albert P | $312,000 |
Source: Public Records
Tax History Compared to Growth
Tax History
| Year | Tax Paid | Tax Assessment Tax Assessment Total Assessment is a certain percentage of the fair market value that is determined by local assessors to be the total taxable value of land and additions on the property. | Land | Improvement |
|---|---|---|---|---|
| 2024 | $10,341 | $882,300 | $542,900 | $339,400 |
| 2023 | $9,543 | $632,400 | $405,100 | $227,300 |
| 2022 | $8,379 | $632,400 | $405,100 | $227,300 |
| 2021 | $8,683 | $632,400 | $405,100 | $227,300 |
| 2020 | $8,052 | $504,200 | $324,300 | $179,900 |
| 2019 | $7,941 | $504,200 | $324,300 | $179,900 |
| 2018 | $7,636 | $469,900 | $290,000 | $179,900 |
| 2017 | $4,196 | $439,600 | $273,400 | $166,200 |
| 2016 | $3,935 | $439,600 | $273,400 | $166,200 |
| 2015 | $6,136 | $414,900 | $259,900 | $155,000 |
| 2014 | $6,336 | $414,900 | $259,900 | $155,000 |
| 2013 | $6,336 | $414,900 | $259,900 | $155,000 |
Source: Public Records
Map
Nearby Homes
- 126 Ocean Blvd
- 595 N End Blvd Unit 2
- 308 State Route 286 Unit Lot 73
- 308 State Route 286 Unit Lot 108
- 308 State Route 286 Unit Lot 23
- 308 State Route 286 Unit Lot 87
- 9 Tyngsboro St
- 376 Ocean Blvd
- 27 Cross Beach Rd
- 522 N End Blvd
- 498 N End Blvd
- 492 N End Blvd
- 18 River St
- 308 Route 286 Unit 77
- 308 Route 286 Unit Lot 58
- 108 Ocean Dr Unit 1
- 432 N End Blvd
- 312 S Main St
- 1 Old Salt Dr
- 10 Liberty St
- 2 Ocean Blvd Unit Lower
- 2 Ocean Blvd
- 411 Ocean Blvd
- 226 Ocean Blvd
- 134 Ocean Blvd
- 130 Ocean Blvd
- 122 Ocean Blvd
- 141 Ocean Blvd
- 138 Ocean Blvd
- 8 Groveland St
- 2 Merrimac St
- 128 Ocean Blvd
- 144 Ocean Blvd
- 5 Merrimac St
- 132 Ocean Blvd
- 3 Groveland St
- 140 Ocean Blvd
- 6 Merrimac St
- 6 Merrimack St
- 9 Groveland St