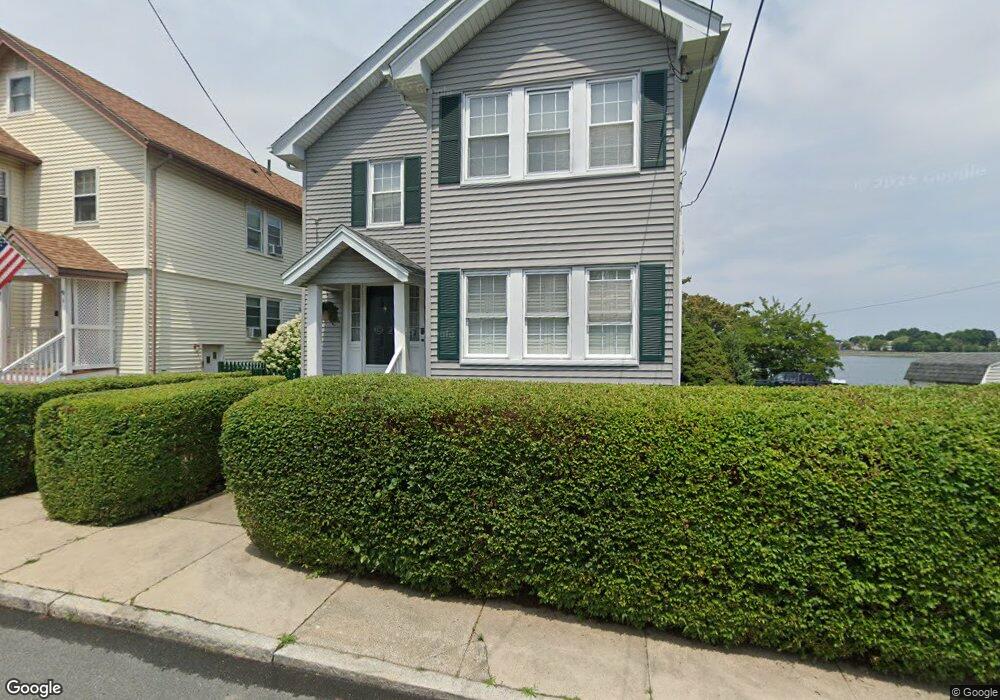
2 Orchard St Salem, MA 01970
North Salem NeighborhoodEstimated Value: $500,585 - $937,000
2
Beds
1
Bath
1,582
Sq Ft
$424/Sq Ft
Est. Value
About This Home
This home is located at 2 Orchard St, Salem, MA 01970 and is currently estimated at $671,146, approximately $424 per square foot. 2 Orchard St is a home located in Essex County with nearby schools including Bates Elementary School, Saltonstall School, and Carlton Elementary School.
Ownership History
Date
Name
Owned For
Owner Type
Purchase Details
Closed on
Dec 10, 2020
Sold by
Sieminski Randel M
Bought by
Sieminski Beth A
Current Estimated Value
Home Financials for this Owner
Home Financials are based on the most recent Mortgage that was taken out on this home.
Original Mortgage
$216,000
Outstanding Balance
$192,571
Interest Rate
2.7%
Mortgage Type
New Conventional
Estimated Equity
$478,575
Purchase Details
Closed on
Jan 27, 2003
Sold by
Sieminski Beth A and Sieminski Randel M
Bought by
Sieminski Randel M
Purchase Details
Closed on
Jun 27, 2001
Sold by
Lemelin Roebrt E and Lemelin Colleen
Bought by
Labelle Gregory J and Labelle Loren M
Purchase Details
Closed on
May 31, 1994
Sold by
Opolski Rt and Opolski
Bought by
Sieminski Randel M and Sieminski Beth
Create a Home Valuation Report for This Property
The Home Valuation Report is an in-depth analysis detailing your home's value as well as a comparison with similar homes in the area
Home Values in the Area
Average Home Value in this Area
Purchase History
| Date | Buyer | Sale Price | Title Company |
|---|---|---|---|
| Sieminski Beth A | -- | None Available | |
| Sieminski Randel M | -- | -- | |
| Labelle Gregory J | $232,000 | -- | |
| Sieminski Randel M | $145,000 | -- |
Source: Public Records
Mortgage History
| Date | Status | Borrower | Loan Amount |
|---|---|---|---|
| Open | Sieminski Beth A | $216,000 | |
| Previous Owner | Sieminski Randel M | $220,000 | |
| Previous Owner | Sieminski Randel M | $215,000 | |
| Previous Owner | Sieminski Randel M | $80,000 |
Source: Public Records
Tax History Compared to Growth
Tax History
| Year | Tax Paid | Tax Assessment Tax Assessment Total Assessment is a certain percentage of the fair market value that is determined by local assessors to be the total taxable value of land and additions on the property. | Land | Improvement |
|---|---|---|---|---|
| 2025 | $4,768 | $420,500 | $0 | $420,500 |
| 2024 | $4,678 | $402,600 | $0 | $402,600 |
| 2023 | $4,569 | $365,200 | $0 | $365,200 |
| 2022 | $4,429 | $334,300 | $0 | $334,300 |
| 2021 | $4,358 | $315,800 | $0 | $315,800 |
| 2020 | $4,282 | $296,300 | $0 | $296,300 |
| 2019 | $4,063 | $269,100 | $0 | $269,100 |
| 2018 | $3,773 | $245,300 | $0 | $245,300 |
| 2017 | $3,672 | $231,500 | $0 | $231,500 |
| 2016 | $3,474 | $221,700 | $0 | $221,700 |
| 2015 | $3,477 | $211,900 | $0 | $211,900 |
Source: Public Records
Map
Nearby Homes
- 41 Dearborn St
- 8 Upham St
- 18 Franklin St Unit 303
- 5 Larchmont Rd Unit 3
- 112 North St
- 3 S Mason St
- 27 Appleton St
- 156 Bridge St Unit B
- 0 Lot 41 Map 10 Unit 73335079
- 0 Lot 61 Map 10 Unit 73335091
- 78 Federal St
- 47 Federal St
- 103 Bridge St Unit 2
- 15 Lynde St Unit 26
- 8 Williams St Unit 2
- 26 Winter St
- 304 Essex St Unit 1
- 14 Lathrop St
- 289 Essex St Unit 307
- 11 Summer St