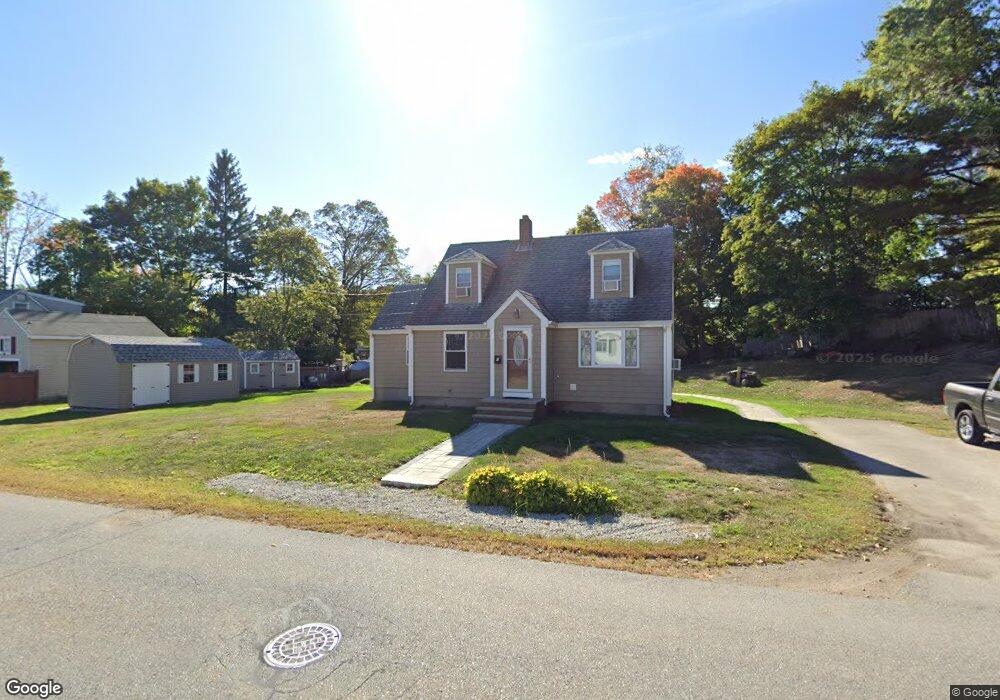
2 Pakachoag St Auburn, MA 01501
Pakachoag NeighborhoodEstimated Value: $474,000 - $496,000
4
Beds
3
Baths
1,182
Sq Ft
$409/Sq Ft
Est. Value
About This Home
This home is located at 2 Pakachoag St, Auburn, MA 01501 and is currently estimated at $482,976, approximately $408 per square foot. 2 Pakachoag St is a home located in Worcester County with nearby schools including Auburn Senior High School and Canterbury Street School.
Ownership History
Date
Name
Owned For
Owner Type
Purchase Details
Closed on
Oct 23, 2023
Sold by
Manzaro Caitlin
Bought by
Caitlin Manzaro Ret and Manzaro
Current Estimated Value
Purchase Details
Closed on
May 20, 2022
Sold by
Manzaro John R and Zmayefski Caitlin K
Bought by
Manzaro Caitlin
Home Financials for this Owner
Home Financials are based on the most recent Mortgage that was taken out on this home.
Original Mortgage
$150,000
Interest Rate
5%
Mortgage Type
New Conventional
Purchase Details
Closed on
Mar 7, 2014
Sold by
Skrodzka Olga and Skrodzki Marcin
Bought by
Manzaro John R and Zmayefski Caitlin K
Home Financials for this Owner
Home Financials are based on the most recent Mortgage that was taken out on this home.
Original Mortgage
$185,000
Interest Rate
4.39%
Mortgage Type
New Conventional
Purchase Details
Closed on
Aug 19, 2013
Sold by
Humphrey John S
Bought by
Skrodzki Olga and Skrodzki Marcin
Home Financials for this Owner
Home Financials are based on the most recent Mortgage that was taken out on this home.
Original Mortgage
$96,080
Interest Rate
4.31%
Mortgage Type
New Conventional
Purchase Details
Closed on
Jun 3, 2013
Sold by
Humphrey Joyce A
Bought by
Humphrey John S
Create a Home Valuation Report for This Property
The Home Valuation Report is an in-depth analysis detailing your home's value as well as a comparison with similar homes in the area
Home Values in the Area
Average Home Value in this Area
Purchase History
| Date | Buyer | Sale Price | Title Company |
|---|---|---|---|
| Caitlin Manzaro Ret | -- | None Available | |
| Caitlin Manzaro Ret | -- | None Available | |
| Manzaro Caitlin | -- | None Available | |
| Manzaro Caitlin | -- | None Available | |
| Manzaro John R | $245,000 | -- | |
| Skrodzki Olga | $120,100 | -- | |
| Skrodzki Olga | $120,100 | -- | |
| Humphrey John S | -- | -- | |
| Humphrey John S | -- | -- |
Source: Public Records
Mortgage History
| Date | Status | Borrower | Loan Amount |
|---|---|---|---|
| Previous Owner | Manzaro Caitlin | $150,000 | |
| Previous Owner | Manzaro John R | $185,000 | |
| Previous Owner | Skrodzki Olga | $96,080 |
Source: Public Records
Tax History
| Year | Tax Paid | Tax Assessment Tax Assessment Total Assessment is a certain percentage of the fair market value that is determined by local assessors to be the total taxable value of land and additions on the property. | Land | Improvement |
|---|---|---|---|---|
| 2025 | $62 | $436,800 | $127,900 | $308,900 |
| 2024 | $6,309 | $422,600 | $122,600 | $300,000 |
| 2023 | $5,979 | $376,500 | $111,500 | $265,000 |
| 2022 | $5,566 | $330,900 | $111,500 | $219,400 |
| 2021 | $5,193 | $286,300 | $98,400 | $187,900 |
| 2020 | $5,016 | $279,000 | $98,400 | $180,600 |
| 2019 | $4,916 | $266,900 | $97,500 | $169,400 |
| 2018 | $4,632 | $251,200 | $91,200 | $160,000 |
| 2017 | $4,363 | $237,900 | $82,700 | $155,200 |
| 2016 | $4,222 | $233,400 | $85,800 | $147,600 |
| 2015 | $3,953 | $229,000 | $85,800 | $143,200 |
| 2014 | $2,932 | $169,600 | $81,700 | $87,900 |
Source: Public Records
Map
Nearby Homes