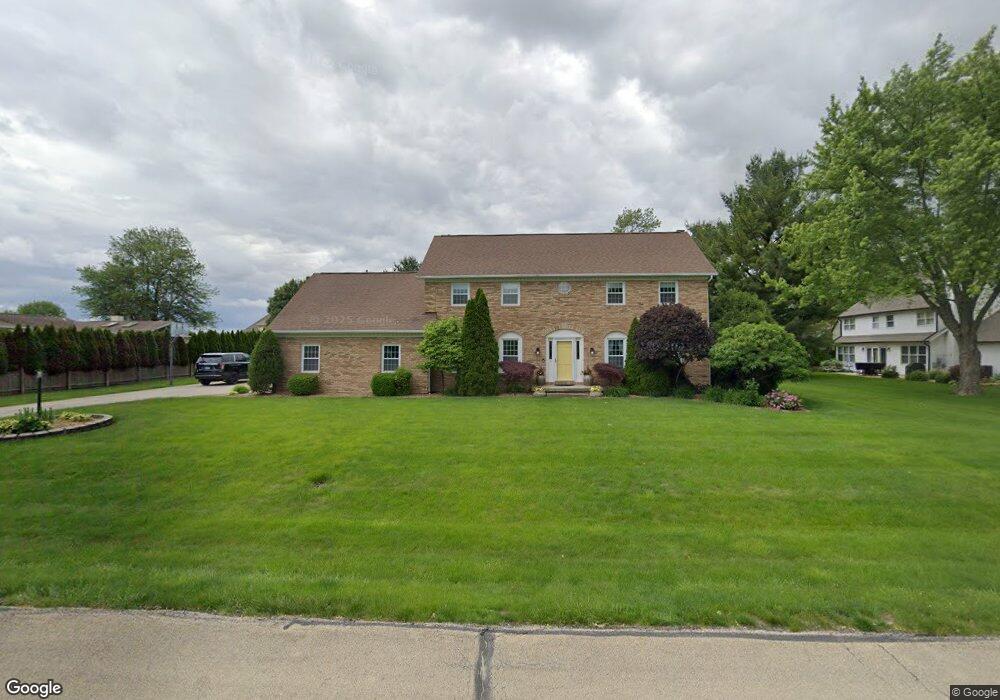
2 Pinehurst Dr Mattoon, IL 61938
Estimated Value: $355,000 - $413,000
4
Beds
3
Baths
4,131
Sq Ft
$91/Sq Ft
Est. Value
About This Home
This home is located at 2 Pinehurst Dr, Mattoon, IL 61938 and is currently estimated at $375,299, approximately $90 per square foot. 2 Pinehurst Dr is a home located in Coles County with nearby schools including Mattoon High School.
Ownership History
Date
Name
Owned For
Owner Type
Purchase Details
Closed on
Jan 31, 2018
Sold by
Dan Pilson Auto Center Inc
Bought by
Prior Jeffrey W and Prior Tina M
Current Estimated Value
Home Financials for this Owner
Home Financials are based on the most recent Mortgage that was taken out on this home.
Original Mortgage
$204,000
Interest Rate
3.95%
Mortgage Type
New Conventional
Purchase Details
Closed on
Feb 29, 2008
Sold by
Richardson Alan D and Richardson Brooke N
Bought by
Dan Pilson Auto Center Inc
Home Financials for this Owner
Home Financials are based on the most recent Mortgage that was taken out on this home.
Original Mortgage
$203,400
Interest Rate
6.25%
Mortgage Type
Purchase Money Mortgage
Purchase Details
Closed on
Dec 14, 2005
Sold by
Desmond James and Desmond Patricia
Bought by
Richardson Alan D and Richardson Brooke N
Home Financials for this Owner
Home Financials are based on the most recent Mortgage that was taken out on this home.
Original Mortgage
$180,000
Interest Rate
6.48%
Mortgage Type
New Conventional
Create a Home Valuation Report for This Property
The Home Valuation Report is an in-depth analysis detailing your home's value as well as a comparison with similar homes in the area
Home Values in the Area
Average Home Value in this Area
Purchase History
| Date | Buyer | Sale Price | Title Company |
|---|---|---|---|
| Prior Jeffrey W | $229,000 | -- | |
| Dan Pilson Auto Center Inc | $226,000 | None Available | |
| Richardson Alan D | $225,000 | None Available |
Source: Public Records
Mortgage History
| Date | Status | Borrower | Loan Amount |
|---|---|---|---|
| Closed | Prior Jeffrey W | $204,000 | |
| Previous Owner | Dan Pilson Auto Center Inc | $203,400 | |
| Previous Owner | Richardson Alan D | $180,000 |
Source: Public Records
Tax History
| Year | Tax Paid | Tax Assessment Tax Assessment Total Assessment is a certain percentage of the fair market value that is determined by local assessors to be the total taxable value of land and additions on the property. | Land | Improvement |
|---|---|---|---|---|
| 2024 | $6,240 | $99,886 | $18,132 | $81,754 |
| 2023 | $5,648 | $89,987 | $16,335 | $73,652 |
| 2022 | $5,648 | $88,500 | $16,065 | $72,435 |
| 2021 | $5,539 | $79,730 | $17,189 | $62,541 |
| 2020 | $5,515 | $82,609 | $17,810 | $64,799 |
| 2019 | $5,405 | $79,730 | $17,189 | $62,541 |
| 2018 | $5,326 | $79,730 | $17,189 | $62,541 |
| 2017 | $5,331 | $79,730 | $17,189 | $62,541 |
| 2016 | $5,226 | $79,730 | $17,189 | $62,541 |
| 2015 | $5,591 | $78,167 | $16,852 | $61,315 |
| 2014 | $5,591 | $78,167 | $16,852 | $61,315 |
| 2013 | $5,591 | $78,167 | $16,852 | $61,315 |
Source: Public Records
Map
Nearby Homes
- LOT 46 Edgewater
- LOT 38 Edgewater
- LOT 44 Edgewater
- LOT 35 Broadmoor
- LOT 36 Broadmoor
- LOT 4 Broadmoor
- 0 Lot 8 Augusta Lakes
- 0 Lot 9 Augusta Lakes
- Lot 10 Broadmoor
- 7 Mitchell Ave
- 23 Cambridge
- 21 Cambridge
- 20 Cambridge
- 13 Chestnut Run
- 15 Chestnut Run
- 3 Chestnut Run
- 22 Chestnut Run
- 16 Chestnut Run
- 14 Chestnut Run
- 1412 S 2nd St
- 4 Pinehurst Dr
- 25 S Country Club Rd
- 12 Greenbriar Dr Unit 4
- 12 Greenbriar Dr Unit 1
- 12 Greenbriar Dr
- 12 Greenbriar Dr Unit 6
- 27 S Country Club Rd
- 23 S Country Club Rd
- 11 Greenbriar Dr
- 3 Pinehurst Dr
- 1 Pinehurst Dr
- 10 Greenbriar Dr
- 5 Pinehurst Dr
- 8 A Greenbriar Dr
- 8 Greenbriar Dr Unit B
- 8 Greenbriar Dr Unit A
- 8 Greenbriar Dr
- 6 Greenbriar Dr Unit B
- 6 Greenbriar Dr Unit A
- 6 Greenbriar Dr
Your Personal Tour Guide
Ask me questions while you tour the home.